
Advertisement
Advertisement
Will Gold Break $3,000? Key Levels and Market Trends to Watch
By:
Key Points:
- Gold (XAU) fails to break above $2,955 and corrects lower.
- US Treasury Yield (TNX) breaks below 4.50%.
- US Dollar Index breaks below 107 and remains under bearish pressure.

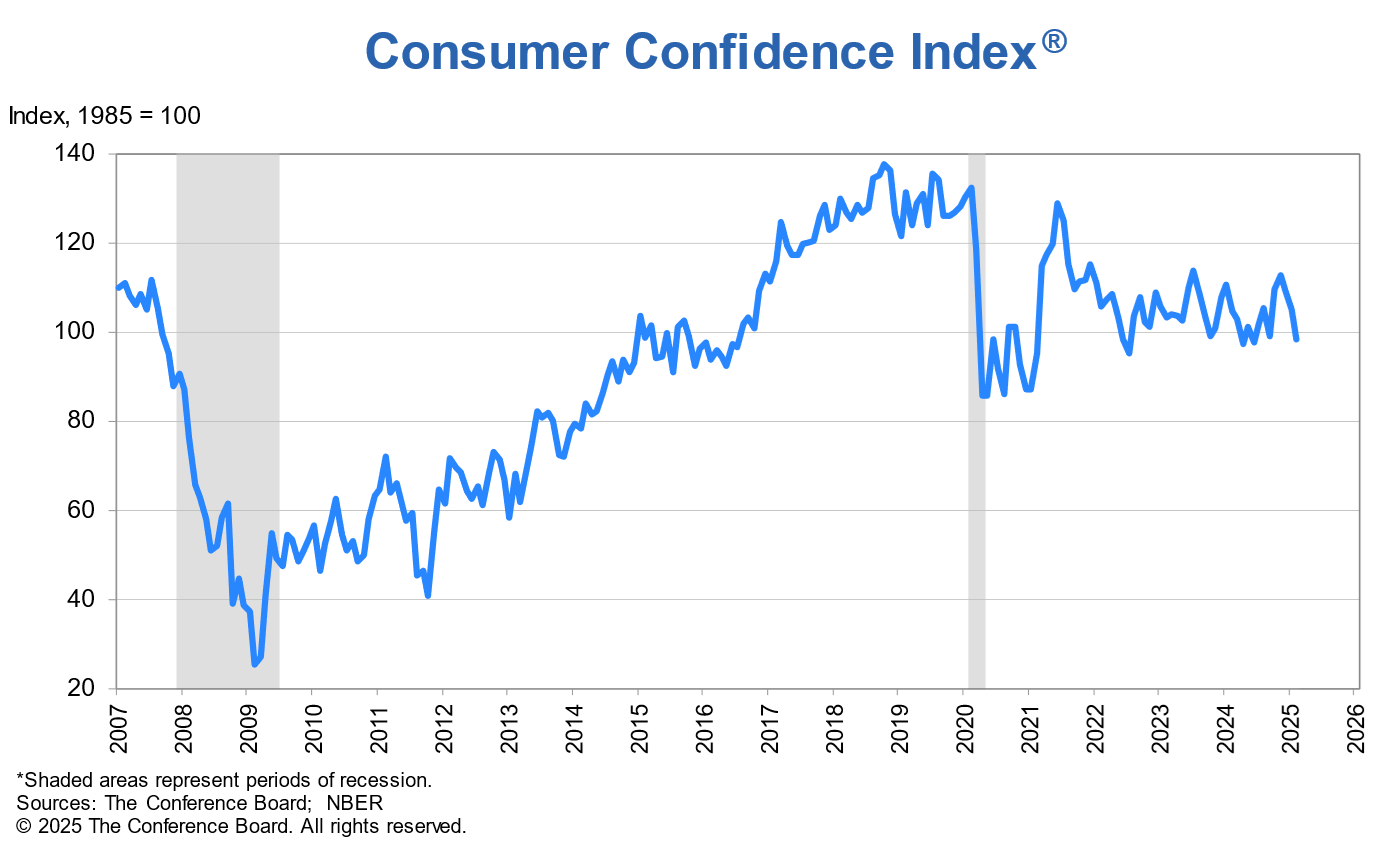
Gold (XAU) prices dropped on Tuesday as traders booked profits amid declining US Treasury yields. The US dollar also weakened due to uncertainty over President Trump’s shifting trade policies. Concerns over Trump’s tariff threats against Mexico and Canada have added to risk aversion. Meanwhile, weak consumer confidence data from the Conference Board reflected growing economic pessimism, as shown in the chart below. This, combined with rising layoffs of federal workers, further fueled fears of a potential stagflationary scenario. Last week, the University of Michigan’s Consumer Sentiment data reinforced these concerns, further weighing on market sentiment.
Despite the initial drop, gold rebounded on Wednesday as investors sought safe-haven assets amid trade war fears. Trump’s decision to proceed with tariffs despite diplomatic efforts heightened economic uncertainty. However, the prospect of prolonged higher interest rates could limit gold’s upside. Gold may struggle to sustain gains if the Federal Reserve maintains a tight monetary policy due to inflation concerns. Additionally, Friday’s upcoming Core PCE Price Index release will be crucial for gold’s next move.
Market participants will closely monitor upcoming economic data and policy signals. In particular, the release of US home sales data may influence short-term price action. Furthermore, Trump’s executive order directing a probe into copper markets adds further uncertainty, potentially affecting broader commodity prices. Moreover, with persistent inflation concerns and ongoing trade tensions, gold remains highly sensitive to shifts in risk sentiment.
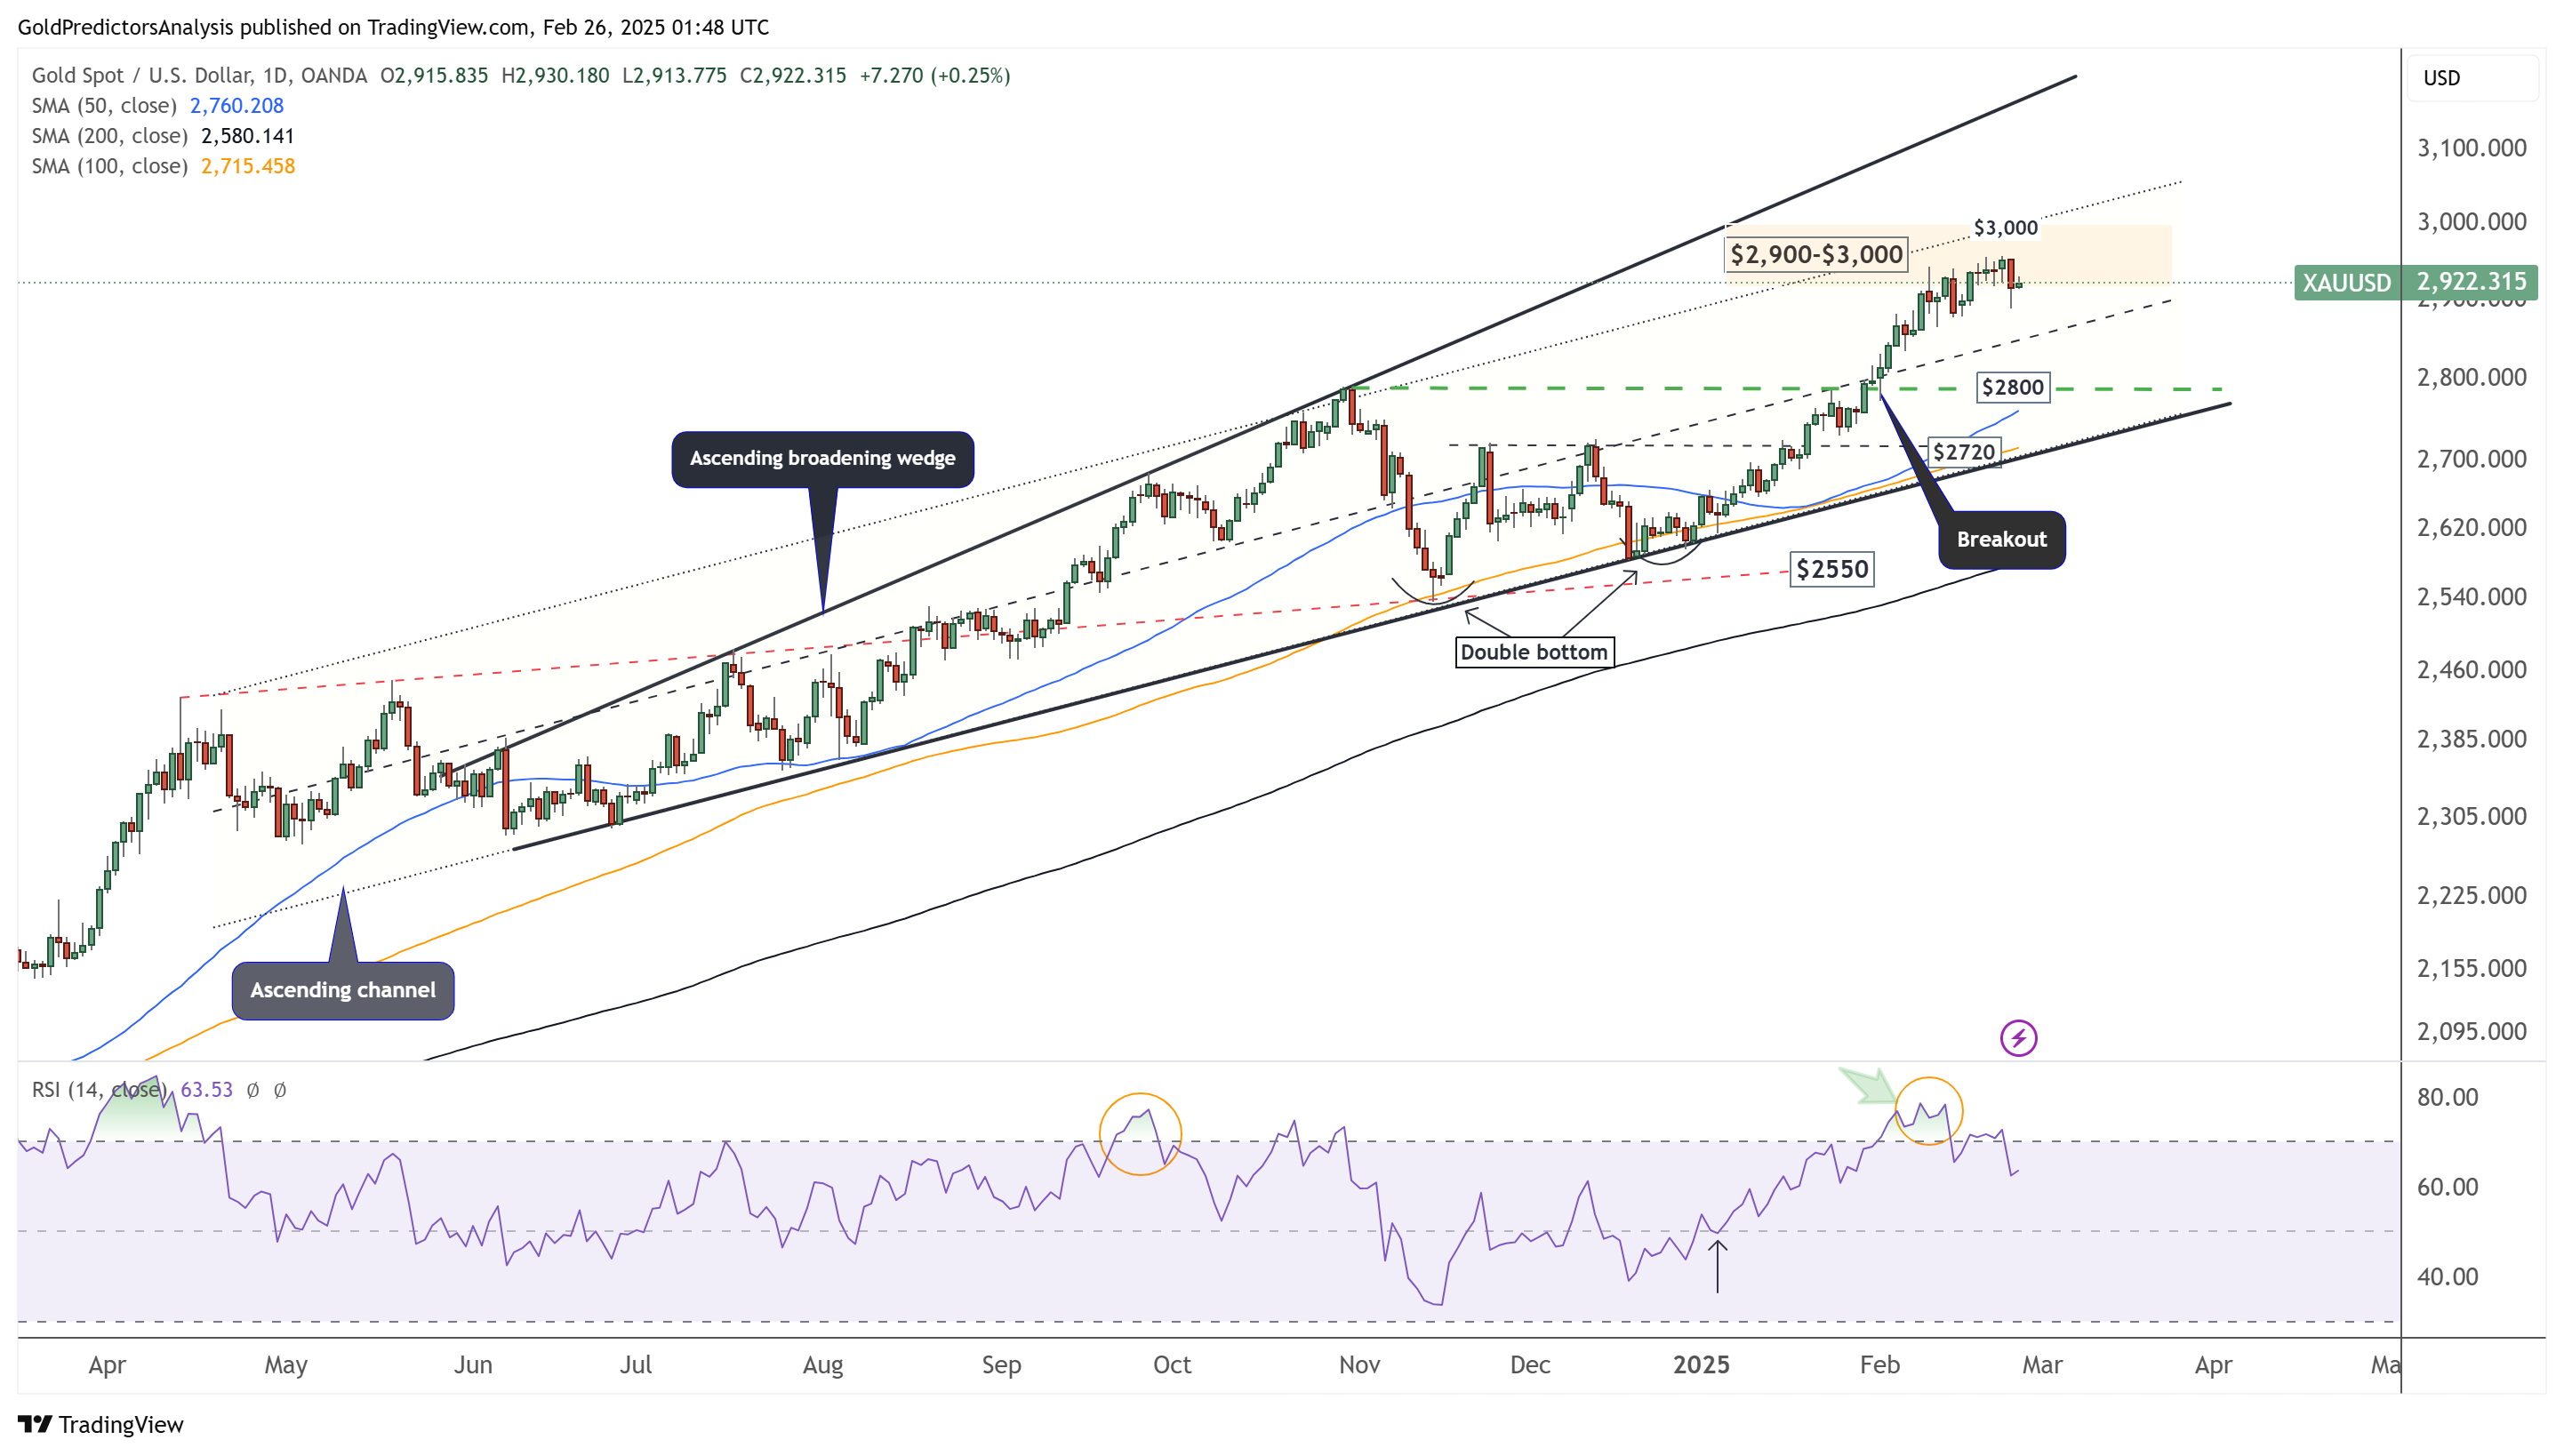
Gold (XAU) Technical Analysis
Gold Daily Chart – Correction
The daily chart for gold shows that the price has fluctuated around $2,950 for the past few days. This consolidation highlights the importance of this price region. If gold fails to break $2,950, the price will likely pull back to stabilize before the next move higher. However, the overall trend remains strongly bullish. A break above $2,950 will initiate a move toward $3,000-$3,200. In a strong correction, the $2,800 level remains a key support. A drop to $2,800 will be a good buying opportunity with a target of $3,000 to $3,200.
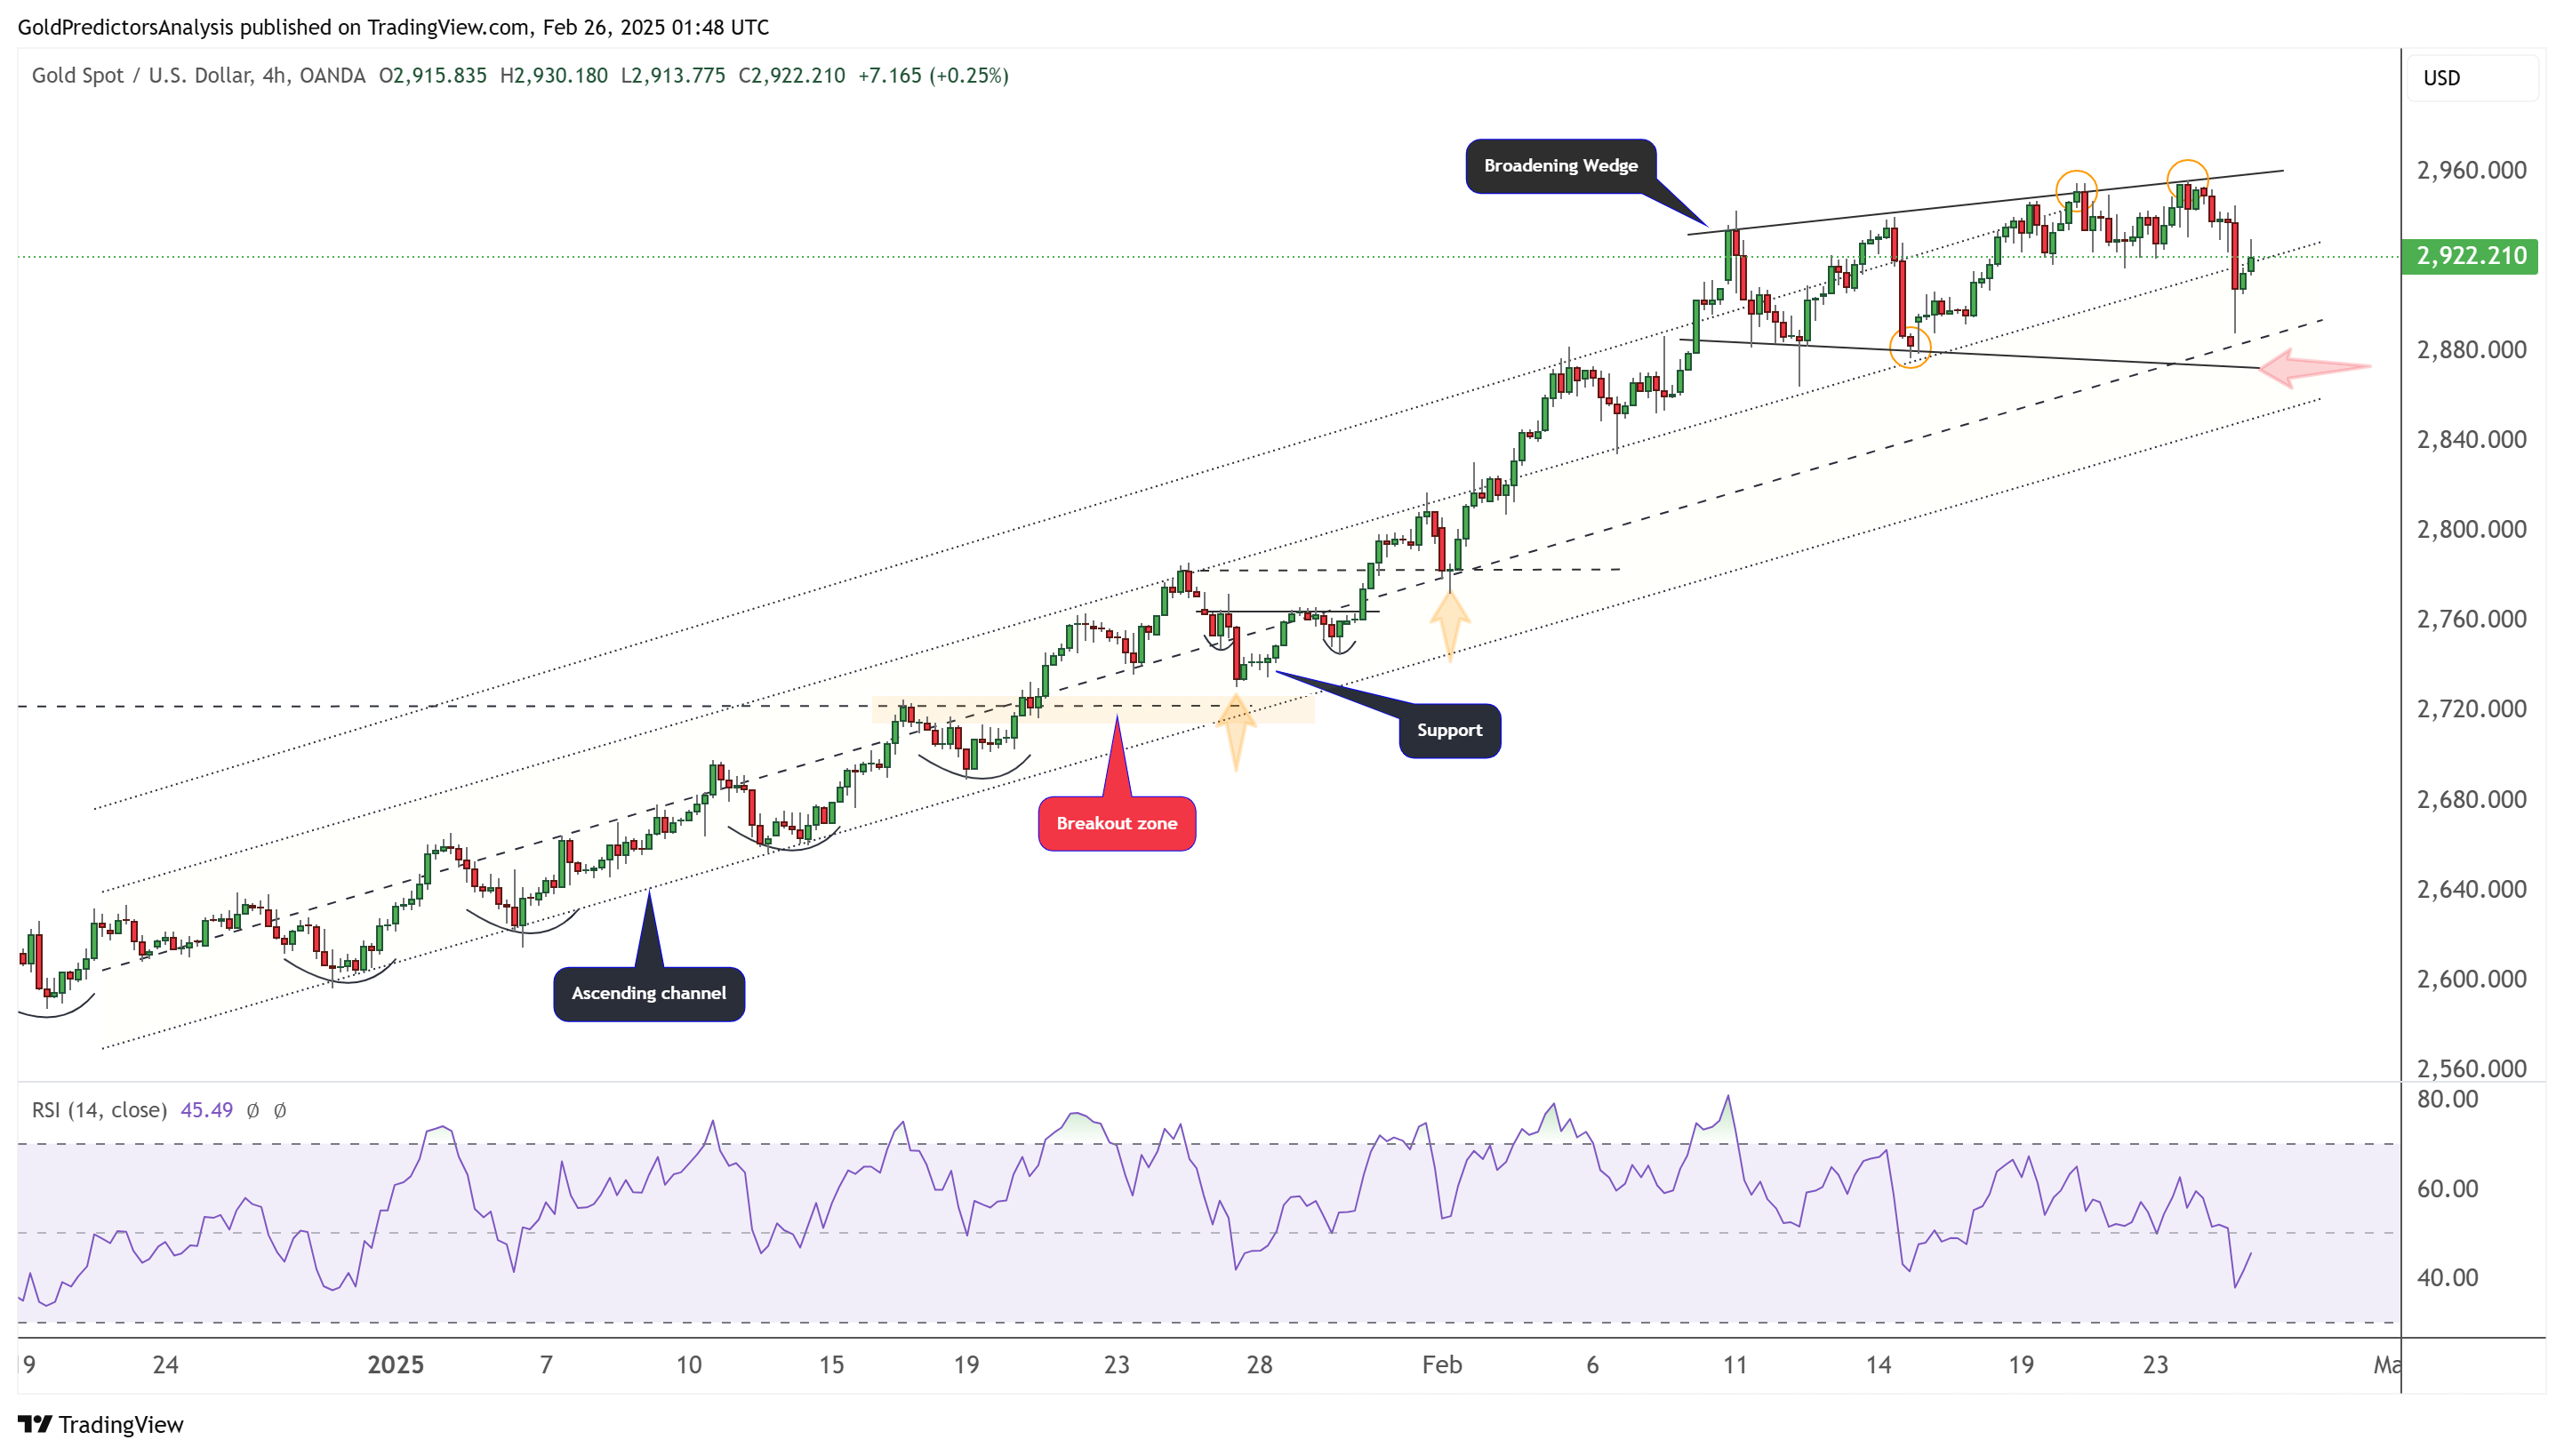
Gold 4-Hour Chart – Broadening Wedge
The 4-hour chart for gold shows that the price has been volatile within a broadening wedge pattern at record levels, indicating that the next move will likely follow from this pattern. A break above $2,950 will confirm the upward trend. The RSI remains below the mid-level, suggesting further price correction in gold.
Treasury Yields (TNX) Technical Analysis
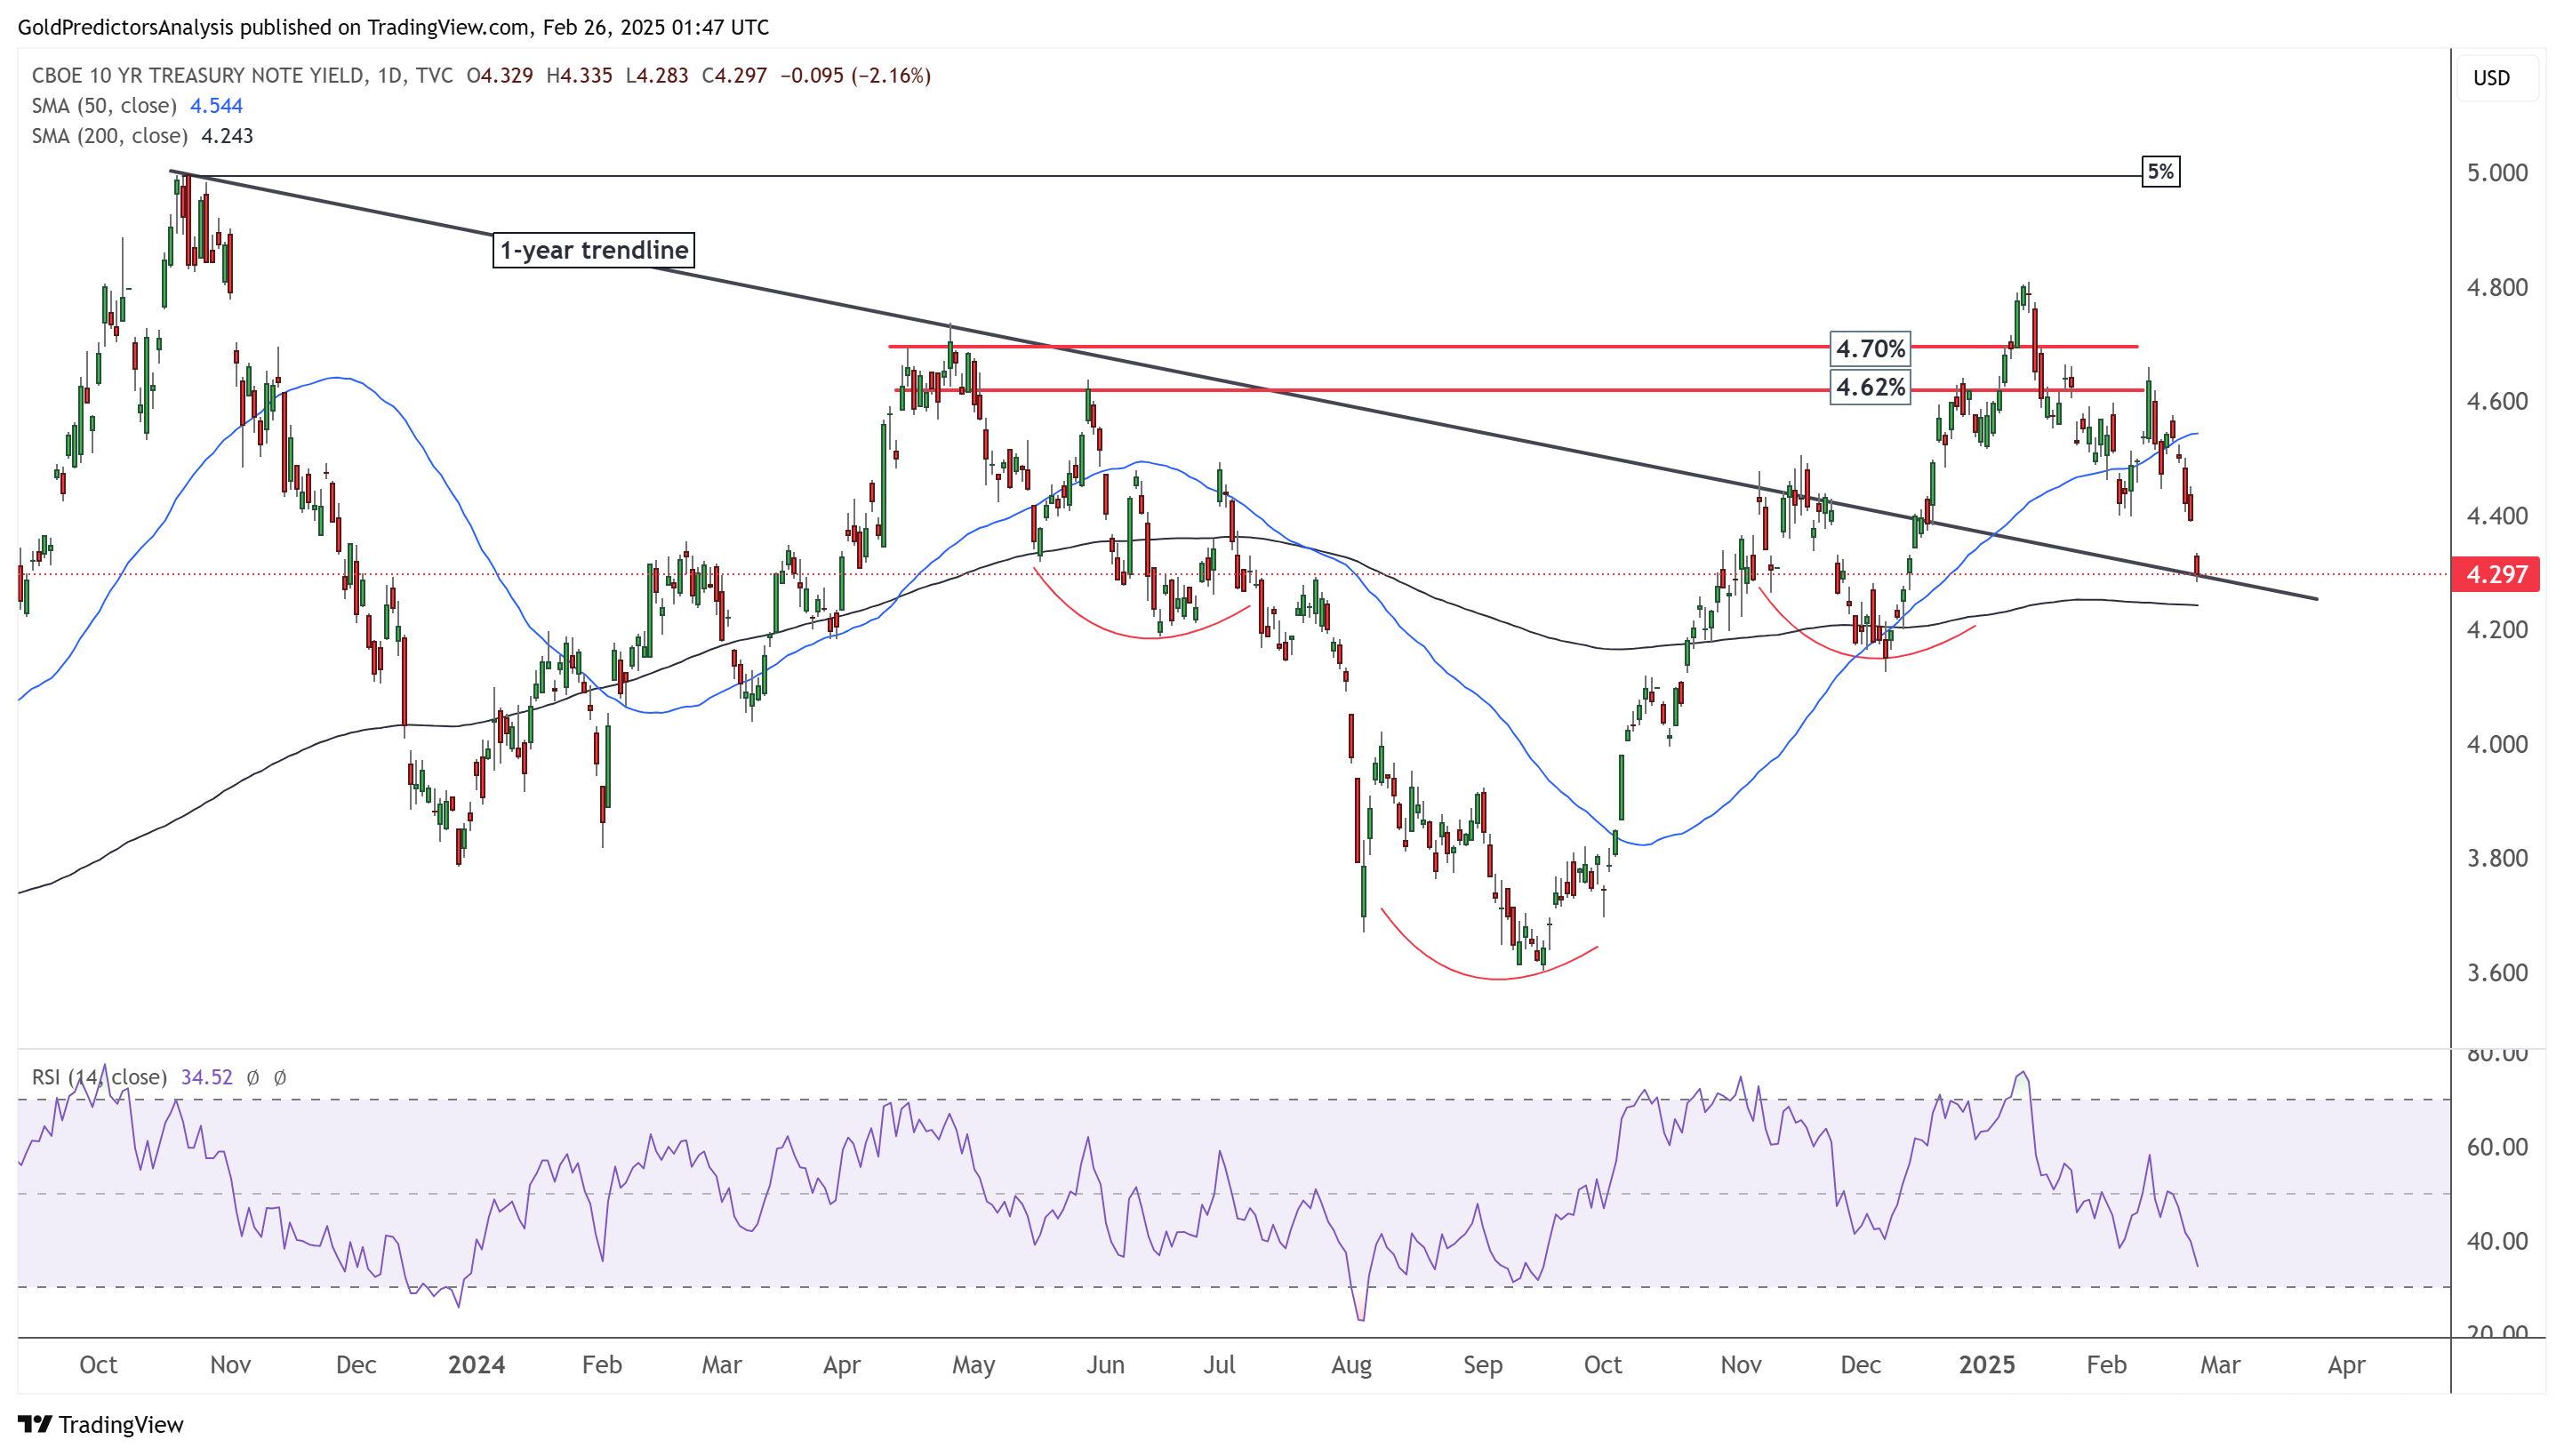
10-Year Treasury Note Yield Daily Chart – Correction
The daily chart for US Treasury yields shows that yields have dropped from the 4.70% resistance and reached the 4.30% support at the one-year trendline. This support is also significant due to the 200-day SMA, which is 4.25%. A break below 4.25%-4.10% will confirm further downside. However, a rally above 4.70% will indicate the continuation of the bullish trend.
10-Year Treasury Note Yield 4-Hour Chart – Correction
The 4-hour chart for US Treasury yields shows that the yield has been trading within an ascending channel and has broken below 4.45%. The break from the ascending channel followed a break below the red trendline, indicating a move to the downside. The immediate support on the 4-hour chart remains at 4.10%.

US Dollar (DXY) Technical Analysis
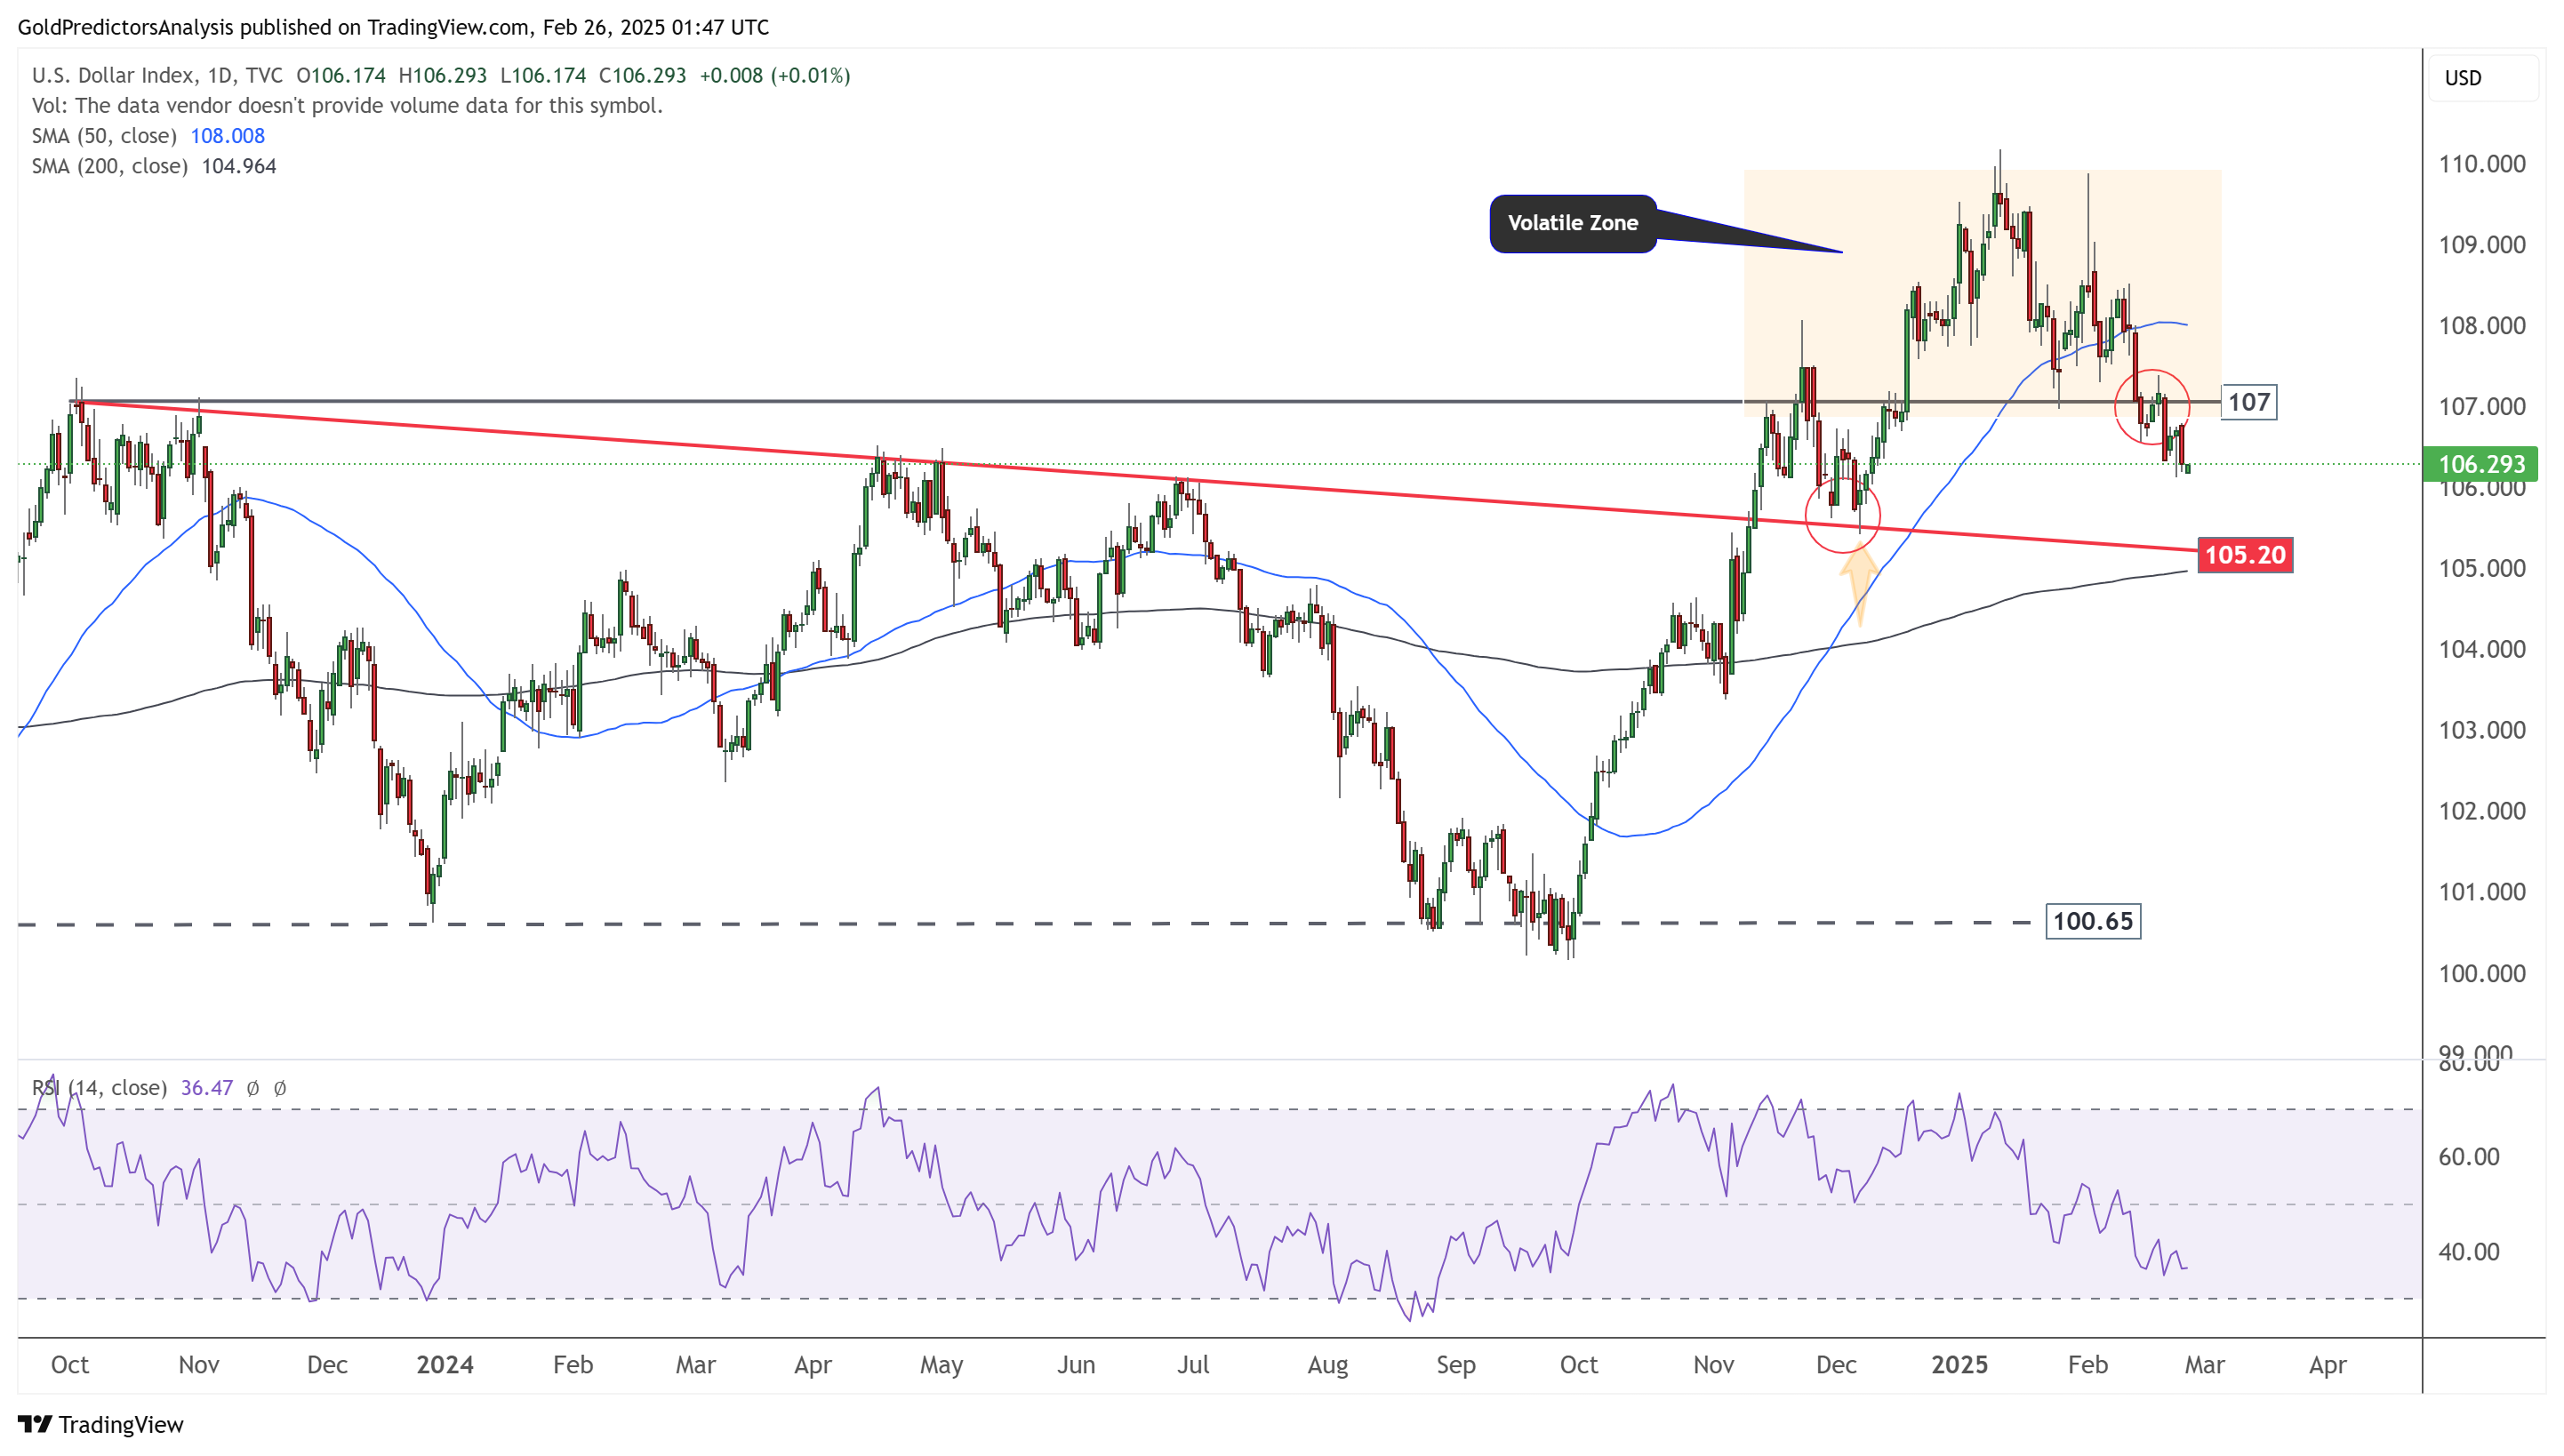
UD Dollar Daily – Bearish Pressure
The daily chart for the US Dollar Index shows that the index has been under bearish pressure after breaking below the 107 level. The next support lies around 105.20, where the 200-day SMA also converges. This support will likely be tested when the RSI reaches the oversold level. The short-term direction for the US dollar remains bearish.
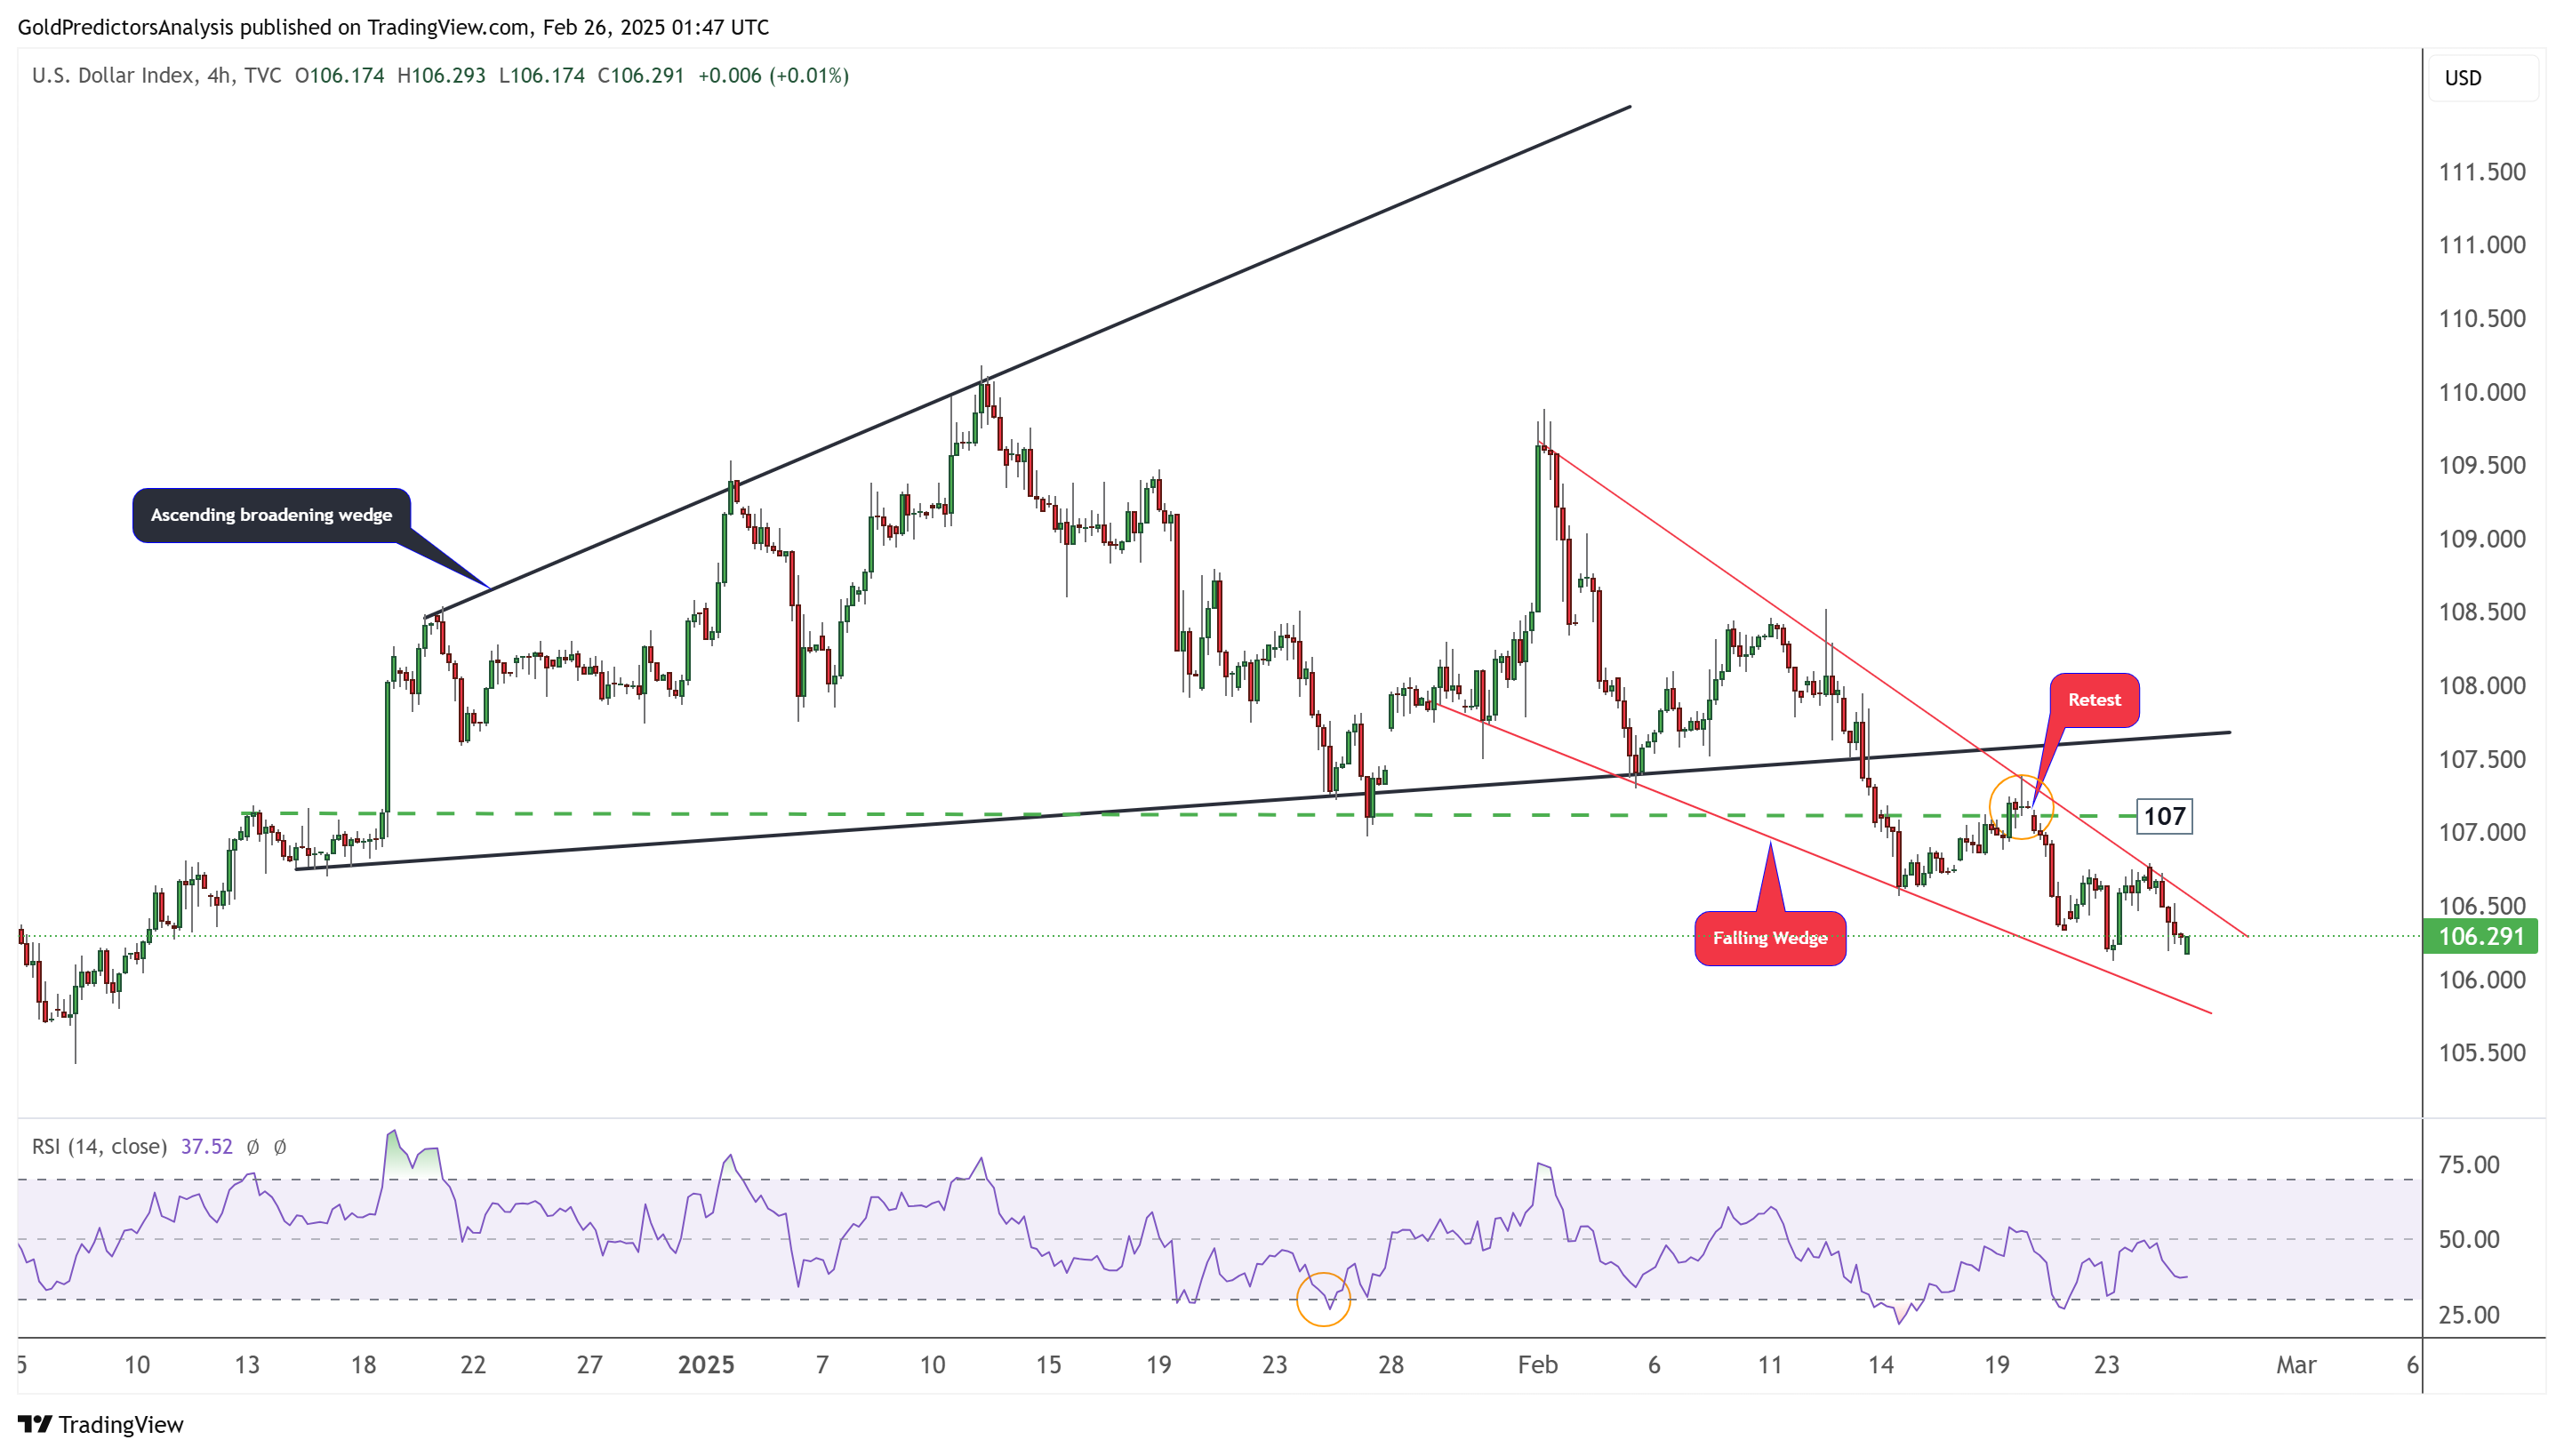
US Dollar 4-Hour Chart – Falling Wedge Pattern
The 4-hour chart for the US Dollar Index shows that the index has broken the ascending broadening wedge pattern and is now trading within a falling wedge pattern. The short-term direction for the US dollar remains bearish. A break above 107 is required to initiate a move higher.
About the Author
Bob MasonChief Crypto Boss
TEST 30 He has written extensively for a broader audience and his current focus is on developments relating to the financial markets including, but not limited to currencies, commodities, alternative asset classes, and global equities.
Latest news and analysis


Advertisement