
Advertisement
Advertisement
Natural Gas and Oil Forecast: Geopolitical Tensions Fuel Uncertainty in Energy Markets
By:
Key Points:
- Geopolitical tensions drive volatility in natural gas and oil markets, impacting supply and price trends.
- Oil prices rebound after U.S. crude stockpiles unexpectedly fell by 640,000 barrels, defying market expectations.
- Natural gas maintains bullish momentum above $4.09 with upward trendline support and potential breakout to $4.43.

Market Overview
Oil prices rebounded slightly from two-month lows after U.S. crude stockpiles unexpectedly fell by 640,000 barrels, contrasting with forecasts of a 2.6-million-barrel increase. Geopolitical tensions, including ongoing international negotiations and potential easing of sanctions, are influencing supply expectations.
Meanwhile, weak economic data from the U.S. and Germany limited price gains, reflecting concerns about global demand.
Fresh U.S. sanctions and possible changes in international trade policies are adding uncertainty to the energy markets. With supply dynamics shifting and demand outlooks uncertain, volatility in oil and natural gas prices is expected to continue in the short term.
Natural Gas Price Forecast
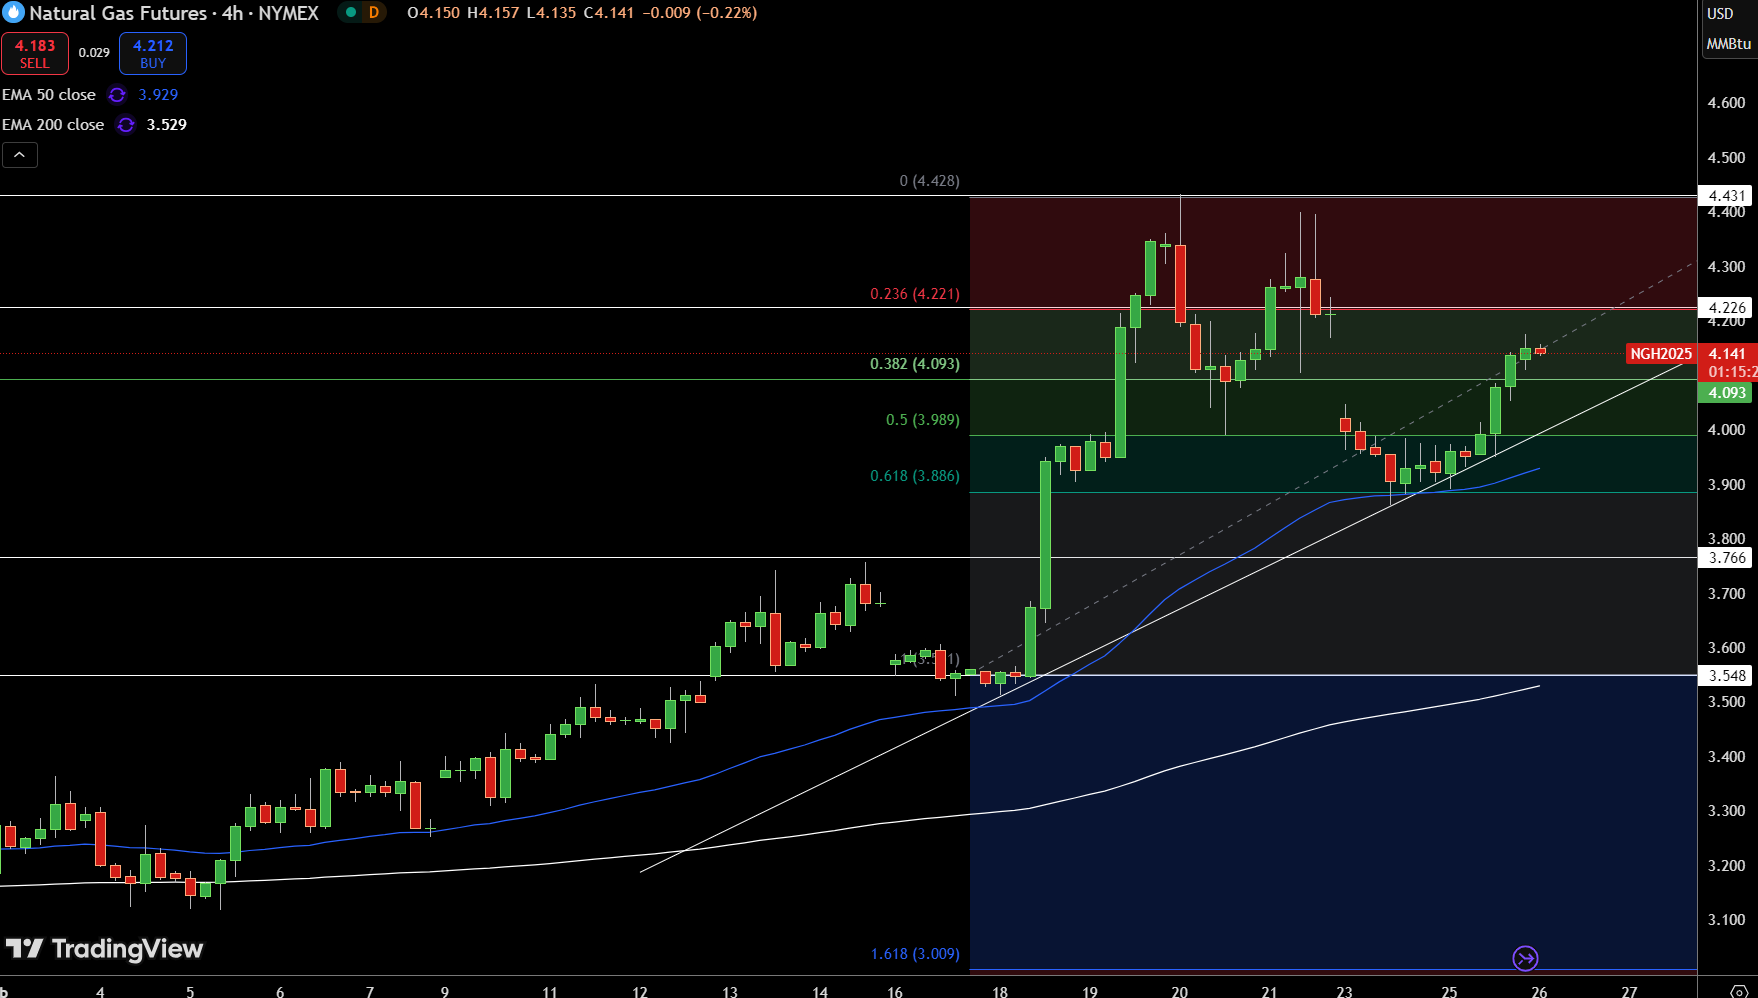
Natural Gas (NG) is trading at $4.15, showing little movement but maintaining a cautious bullish stance. It’s comfortably above the pivot point at $4.09, indicating short-term buying interest. An upward trendline is supporting this buying momentum, acting as a dynamic support level and keeping the bullish bias intact.
If the price holds above $4.09, the next target is immediate resistance at $4.23, with a more ambitious move towards $4.43 if buying pressure continues.
On the downside, a break below $4.09 would flip the sentiment to bearish, potentially driving the price towards $3.77 and then $3.55. The 50 EMA at $3.93 and the 200 EMA at $3.53 both sit below the current price, reinforcing the bullish trend. Watch for volume confirmation to gauge buying strength.
WTI Oil Price Forecast
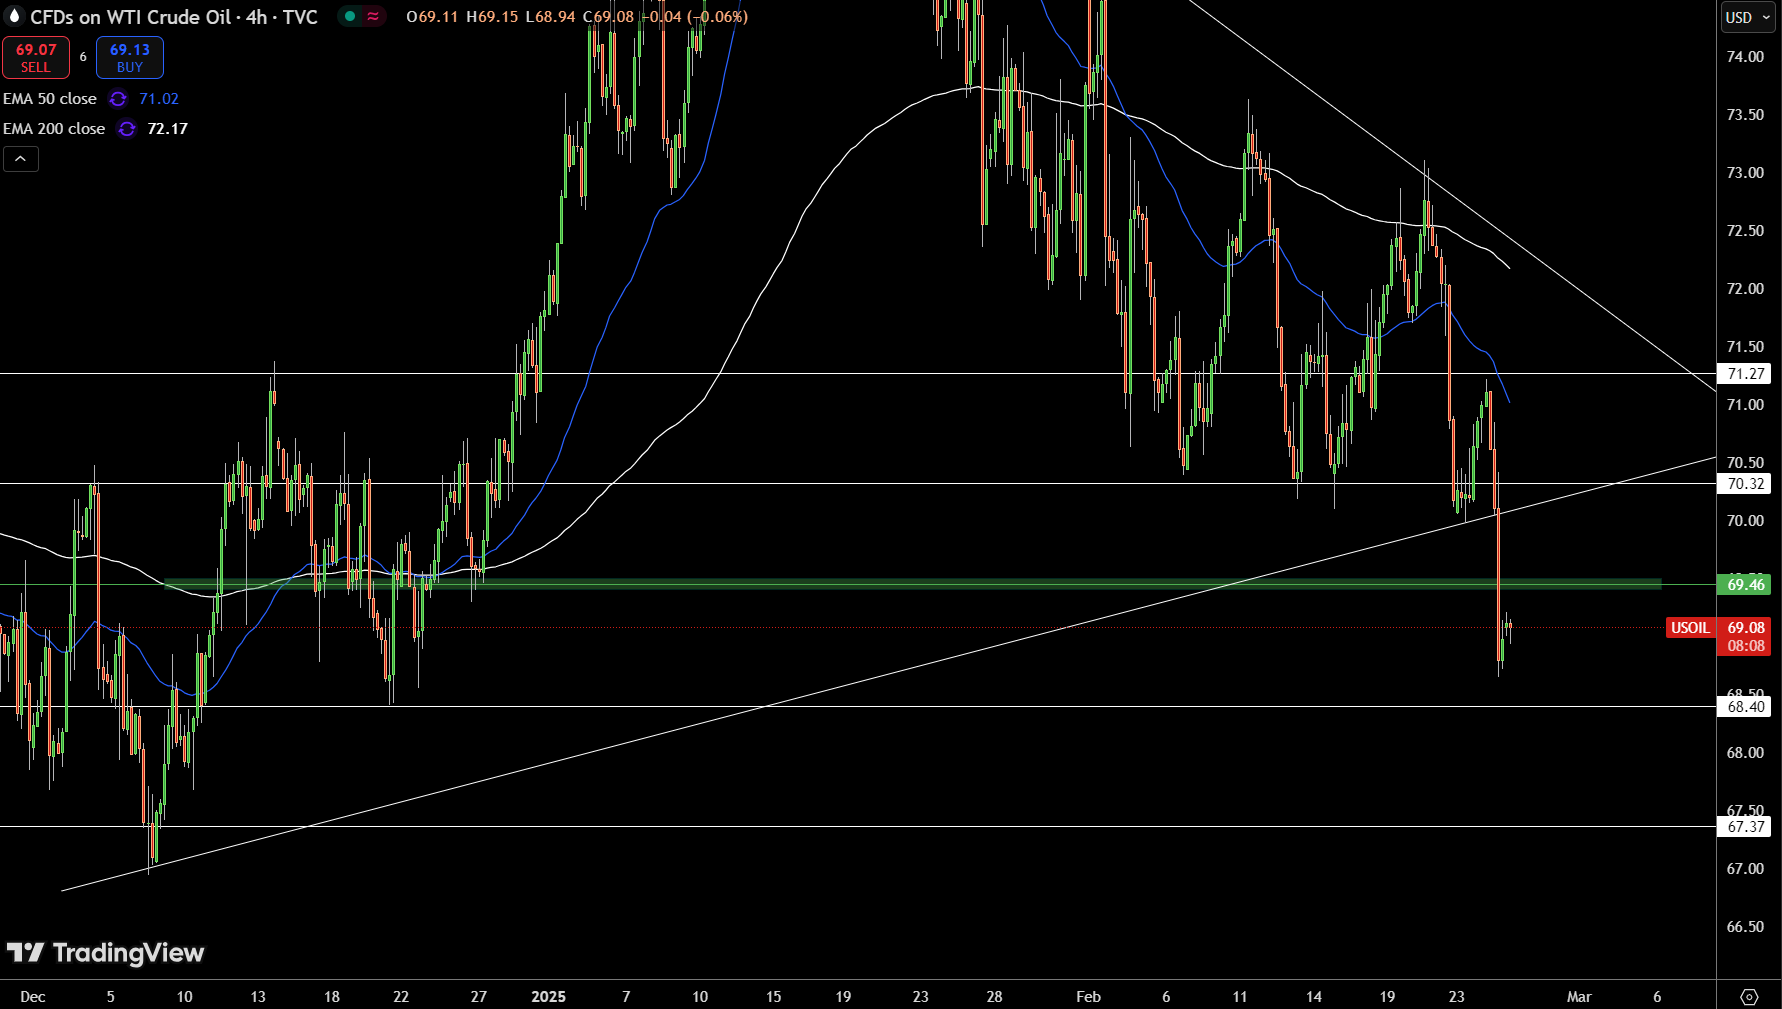
USOIL is trading at $69.07, down 0.03%, reflecting a cautious bearish sentiment. It recently broke below the upward trendline at $69.46, signaling a shift in momentum towards the downside. This breakout, combined with a bearish engulfing candlestick pattern, suggests that selling pressure is building.
If the price remains below the pivot point of $69.46, the next target is immediate support at $68.40, with a deeper decline towards $67.37 if selling intensifies.
On the upside, a move above $69.46 would shift sentiment to bullish, targeting resistance at $70.32 and potentially $71.27. However, with the 50 EMA at $71.02 and the 200 EMA at $72.17 above the current price, the short-term outlook remains bearish.
Brent Oil Price Forecast
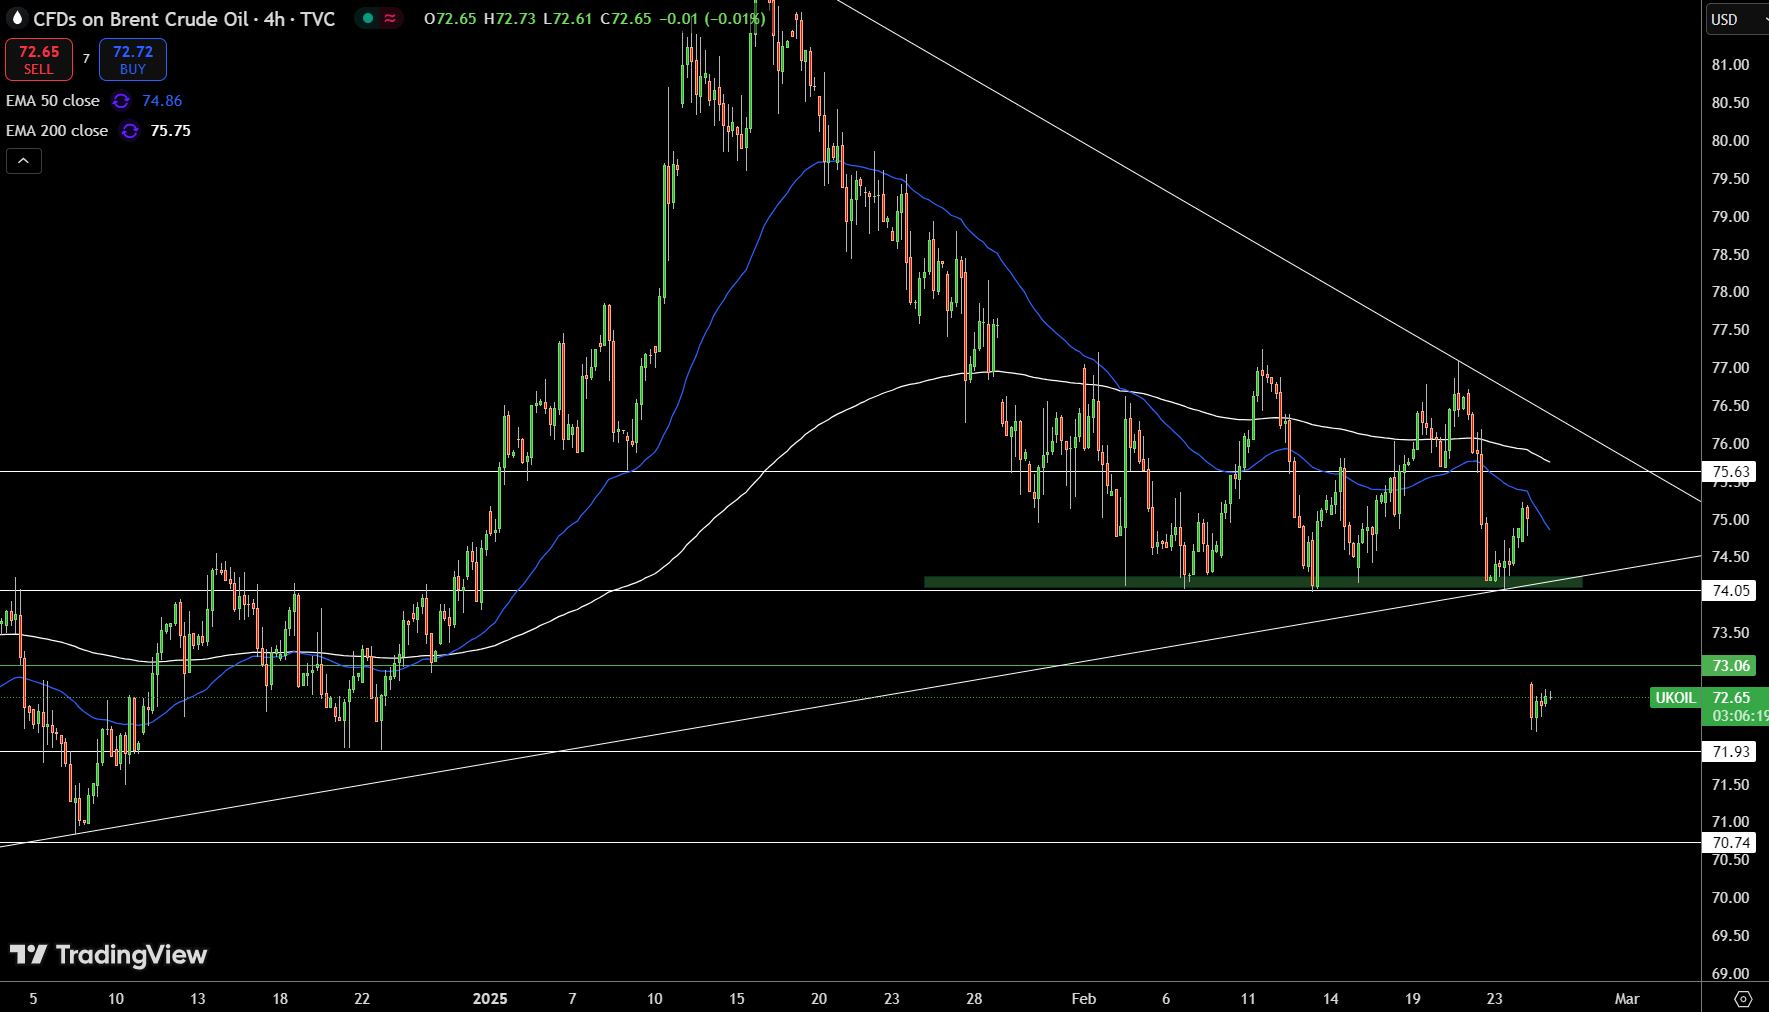
UKOIL is trading at $72.64, down 0.01%, reflecting cautious bearish sentiment as it sits below the pivot point at $73.06. The price is also under the 50 EMA at $74.86 and the 200 EMA at $75.75, reinforcing a short-term bearish outlook.
If the price remains below $73.06, the next target is immediate support at $71.93, with a deeper decline towards $70.74 if selling pressure intensifies.
On the upside, a break above $73.06 would shift sentiment to bullish, targeting resistance at $74.05 and potentially $75.63. However, with downward pressure from both EMAs, the path of least resistance is currently to the downside.
About the Author
Bob MasonChief Crypto Boss
TEST 30 He has written extensively for a broader audience and his current focus is on developments relating to the financial markets including, but not limited to currencies, commodities, alternative asset classes, and global equities.
Latest news and analysis


Advertisement