
Advertisement
Advertisement
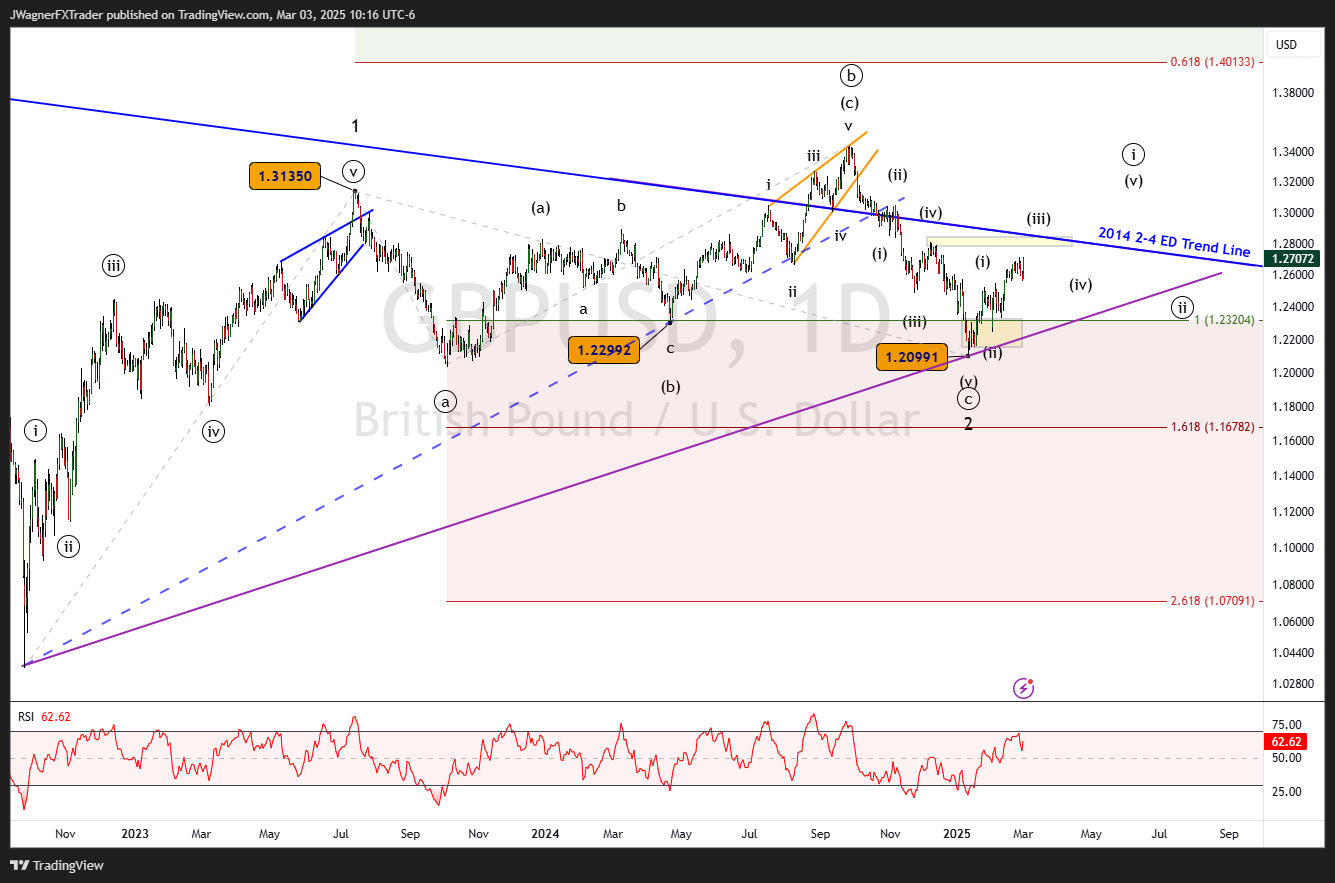
GBP/USD Elliott Wave: 2014 Resistance In Sight
By:
Key Points:
- GBP/USD continues it’s 3rd wave advance.
- 2014 resistance trend line passes near 1.28-1.29.
- We anticipate prices to hold above 1.2099 and the purple trend line en route to 1.50.

GBP/USD Elliott Wave Analysis
GBP/USD found a major bottom on January 13. The low in January finished off a nearly 2-year sideways expanded flat correction dating back to July 2023.
We’re counting the expanded flat as a wave ‘2’ downward correction.
That means the rally since January is the front edge of a wave ‘3’.
I’m showing the current rally in wave (iii) of ((i)) of 3.
GBP/USD Rally Projections
There are some near-term rally projections for wave (iii) near 1.28-1.29. Also, looming in this price zone is a long-term resistance trend line.
Therefore, I suspect wave (iii) finds a resting place in the 1.28-1.29 price zone which will then lead to a little softening in wave (iv).
Long term, the pattern is bullish so any resistance provided by the 2014 trend line is anticipated to be temporary. For example, wave 3 would be 1.618 times the length of wave 1 near 1.53. This is a common wave relationship.
Once waves (iii), (iv), and (v) complete, then it will complete a larger degree wave ((i)). At that point, the largest decline will be underway since Q4 2024. We’ll be keeping a close eye on the purple upward sloping support trend line dating back to 2022. While GBPUSD rallies, any temporary pullbacks should comfortably hold above the purple trend line. There are instances where a second wave might temporarily break that trend line, but it’s not a common occurrence.
Therefore, if the purple trend line is broken, then it will be an early warning dashboard signal that a different Elliott wave pattern is likely playing out.
This long-term forecasted rally lines up with US dollar weakness we are forecasting in EUR/USD too.
Bottom Line
We are anticipating a large multi-month rally to continue towards 1.53 or higher levels. In the near-term, a trend line from 2014 may temporarily suppress prices. Keep an eye on the purple trend line as long-term support.
Key Level for Bullish Bias: 1.2099
Initial Target: 1.29
Secondary Target: 1.53
About the Author
Bob MasonChief Crypto Boss
TEST 30 He has written extensively for a broader audience and his current focus is on developments relating to the financial markets including, but not limited to currencies, commodities, alternative asset classes, and global equities.
Latest news and analysis


Advertisement