
Advertisement
Advertisement
Natural Gas and Oil Forecast: Energy Prices Coil Ahead of U.S.–China Trade Talks
By:
Key Points:
- WTI crude climbs near $66 but remains on track for its worst weekly loss since March, driven by $15-per-barrel volatility.
- Natural gas rebounds from $3.40 lows but faces strong resistance at $3.79–$3.88 with upside momentum fading.
- Brent crude stalls at $67.91 as price compression near key resistance hints at a potential breakout or breakdown.

Market Overview
WTI crude oil futures climbed for a third consecutive session on Friday, nearing $66 per barrel, yet remained poised for their steepest weekly loss since March 2023. The market saw extreme volatility, with a $15-per-barrel range driven by heightened geopolitical tensions early in the week, followed by de-escalation signals that eased fears of regional supply shocks.
Supporting prices, U.S. summer fuel demand has lifted consumption, pushing crude inventories to their lowest seasonal level in 11 years. A weaker dollar also helped stabilize the market. Attention now shifts to U.S.–China trade talks and the pivotal OPEC meeting scheduled for July 6.
Natural Gas Price Forecast
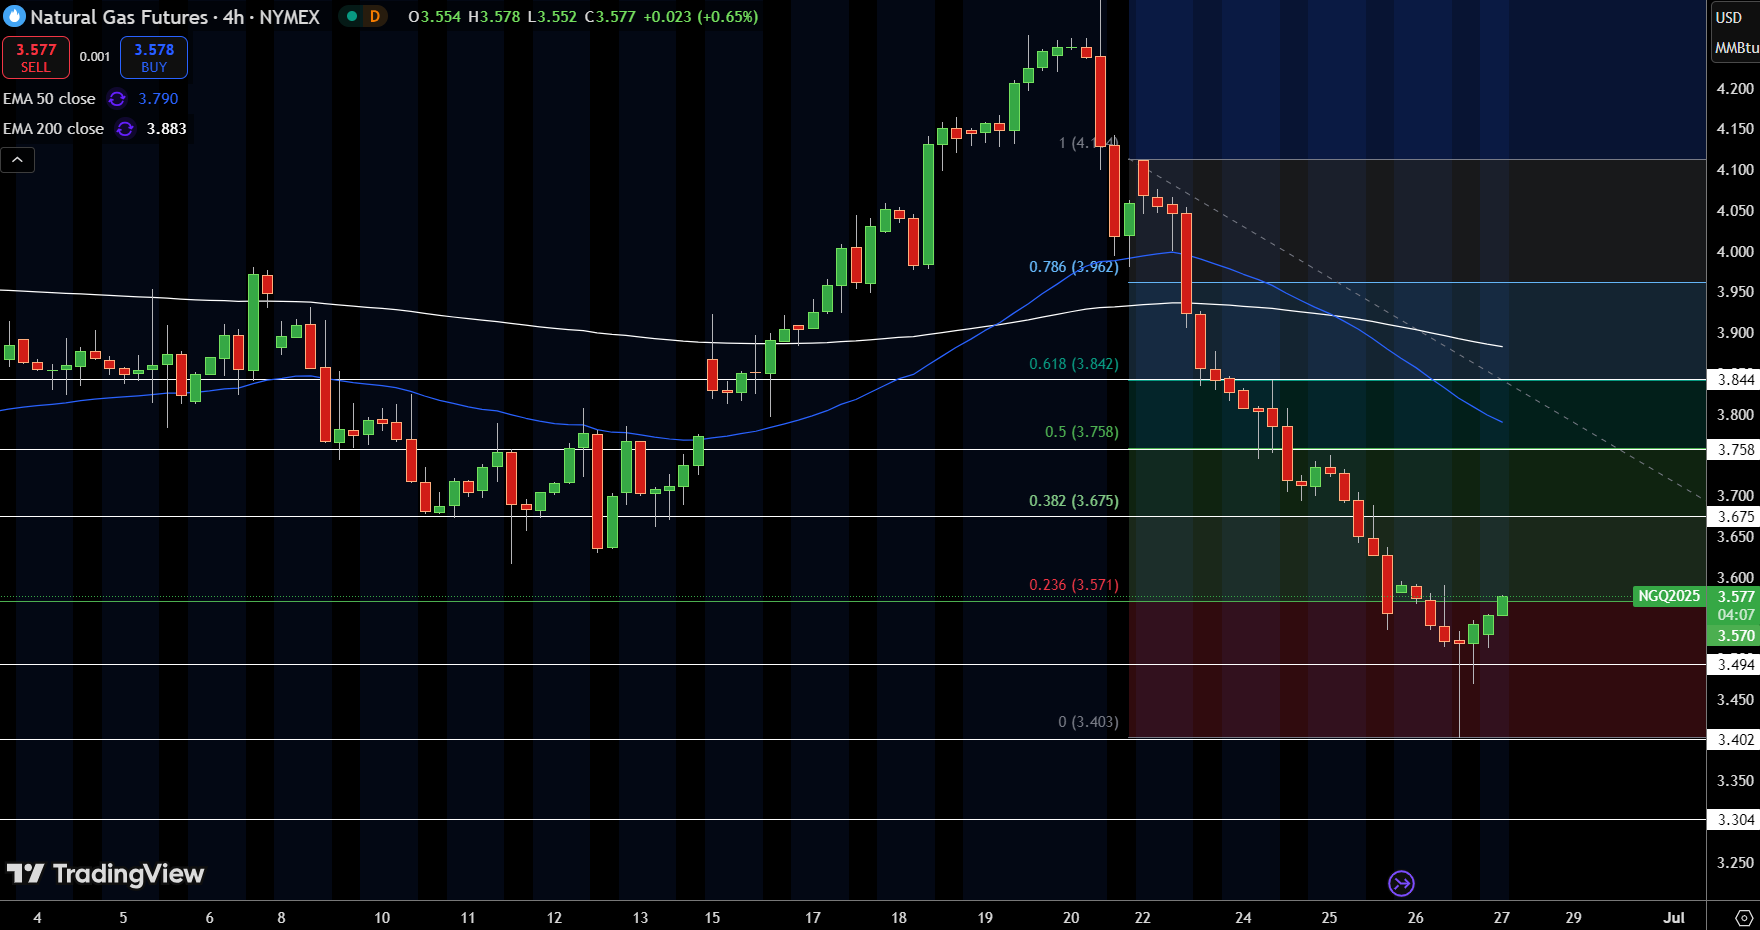
Natural gas futures are attempting a rebound after sliding from the $4.14 peak to a low of $3.40. The price has bounced off the 23.6% Fibonacci retracement level at $3.571 and is now hovering near $3.577. However, upside remains constrained by the cluster of resistance levels ahead, with the 50-period EMA at $3.79 and the 200-period EMA at $3.88 capping recent rallies.
Price would need to reclaim the $3.67–$3.76 range (38.2%–50% Fib zone) to shift momentum. Failure to gain ground above $3.58 could see sellers step back in, targeting $3.49 and $3.40. The current bounce appears corrective within a broader downtrend unless buyers break through key resistance.
WTI Oil Price Forecast
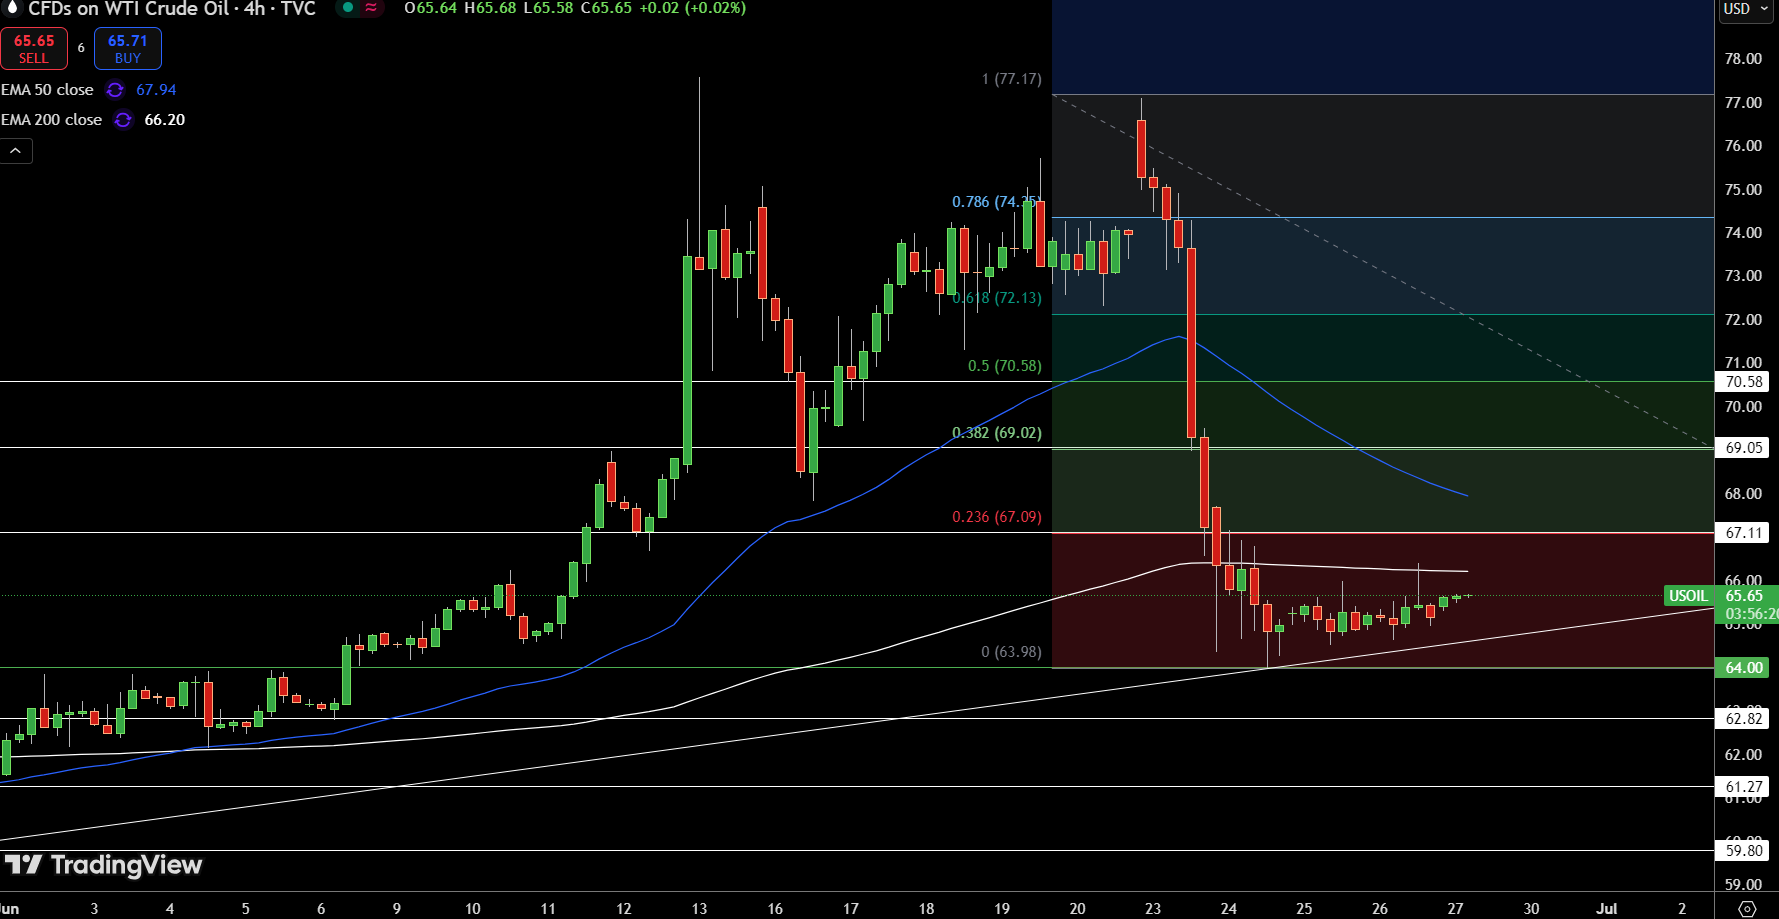
WTI crude is trading at $65.65, holding just above a rising trendline support after last week’s steep $13 selloff from the $77.17 peak. Price is now compressed within a tight consolidation range, capped by the 200-period EMA at $66.20 and the 23.6% Fibonacci level at $67.09.
Despite the rebound from $63.98, upside attempts have stalled below declining averages. A breakout above $67.11 would expose the 38.2% retracement at $69.02, while failure to reclaim $66.20 may trigger a retest of the $64.00 pivot.
This coiling structure suggests a breakout is nearing, but direction remains unclear without a decisive close above or below the range. Momentum remains muted, awaiting clarity from fundamental drivers or technical confirmation.
Brent Oil Price Forecast
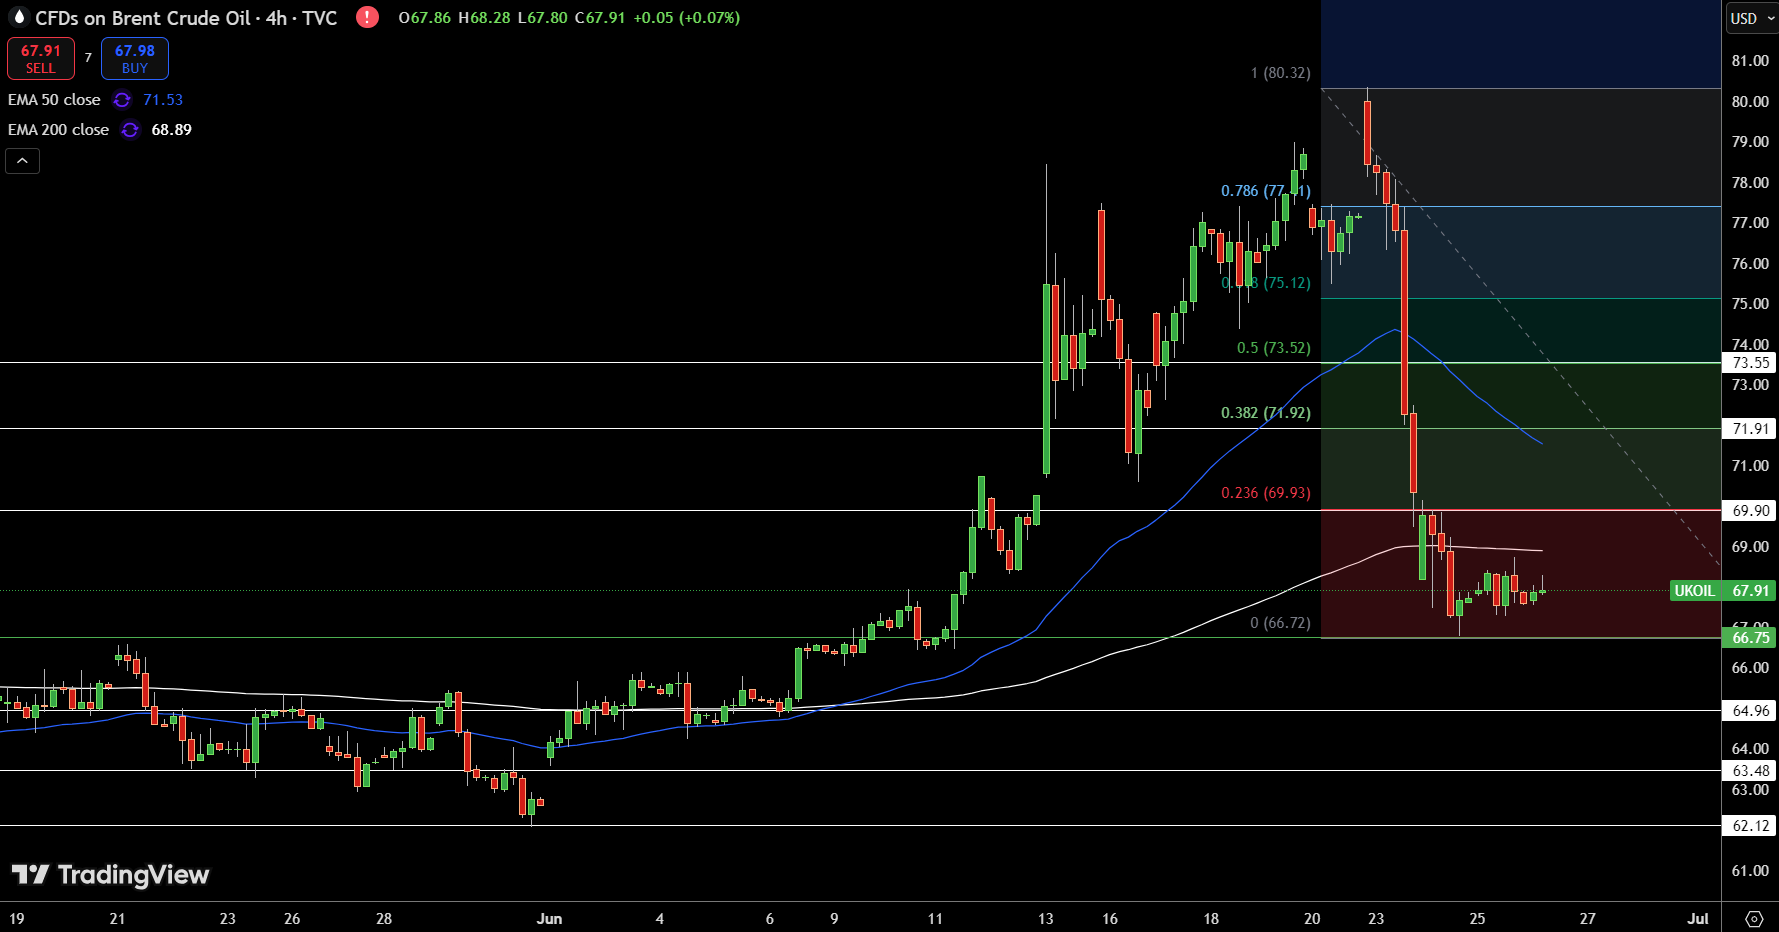
Brent crude is consolidating near $67.91 after last week’s sharp decline from the $80.32 high. Price action remains capped below the 200-period EMA at $68.89, while buyers have struggled to break the 23.6% Fibonacci retracement at $69.93.
The recent range between $66.72 and $69.90 has compressed into a tight band, reflecting indecision as traders weigh broader macro drivers. The 50-period EMA at $71.53 remains distant, and the prevailing structure favors mean reversion unless a breakout confirms.
A close above $69.93 could open the path toward $71.91 and $73.52. Conversely, a breakdown below $66.75 would expose $64.96 and lower. Until then, Brent remains in a holding pattern with range-bound bias.
About the Author
Bob MasonChief Crypto Boss
123456789 30 He has written extensively for a broader audience and his current focus is on developments relating to the financial markets including, but not limited to currencies, commodities, alternative asset classes, and global equities.


Advertisement