
Advertisement
Advertisement
US Dollar Price Forecast: Weak GDP and Dovish Fed Bets Drive Losses – GBP/USD and EUR/USD
By:
Key Points:
- The U.S. Dollar Index sinks to a 3.5-year low near 97.25 amid Fed leadership uncertainty and weak GDP data.
- Trump’s push to replace Fed Chair Powell fuels rate cut bets, with futures pricing in 64bps of easing by year-end.
- U.S. GDP contracts 0.5% in Q1, below expectations, increasing pressure on the Fed and weighing further on the dollar.

Market Overview
During Friday’s Asian session, the U.S. Dollar Index (DXY) extended its decline, hovering near 97.25, its lowest level in over three years. The downtrend reflects mounting uncertainty around Federal Reserve leadership, rising expectations of interest rate cuts, and weaker U.S. economic data.
Fed Leadership Doubts Add to Dovish Outlook
Dollar sentiment weakened after President Donald Trump confirmed he’s close to selecting a new Fed Chair, narrowing his choices to “three or four people.” The market interpreted this as a possible pivot toward a more dovish monetary stance.
Carol Kong, strategist at the Commonwealth Bank of Australia, remarked: “Expectations President Trump will choose a more dovish chair will keep downward pressure on FOMC pricing and the USD.”
Rate cut expectations have surged. According to Reuters, markets now assign a 25% probability to a July rate cut, up from 12% last week. Futures also reflect 64 basis points of easing by year-end.
US GDP Misses Forecasts
The U.S. economy contracted by 0.5% in Q1, missing expectations of a 0.2% decline. The data signals growing economic strain and adds pressure on the Fed to act. Markets now await May’s PCE inflation report, a key metric for the Fed. A hotter print could slow the Dollar’s slide.
US Dollar Index (DXY) – Technical Analysis
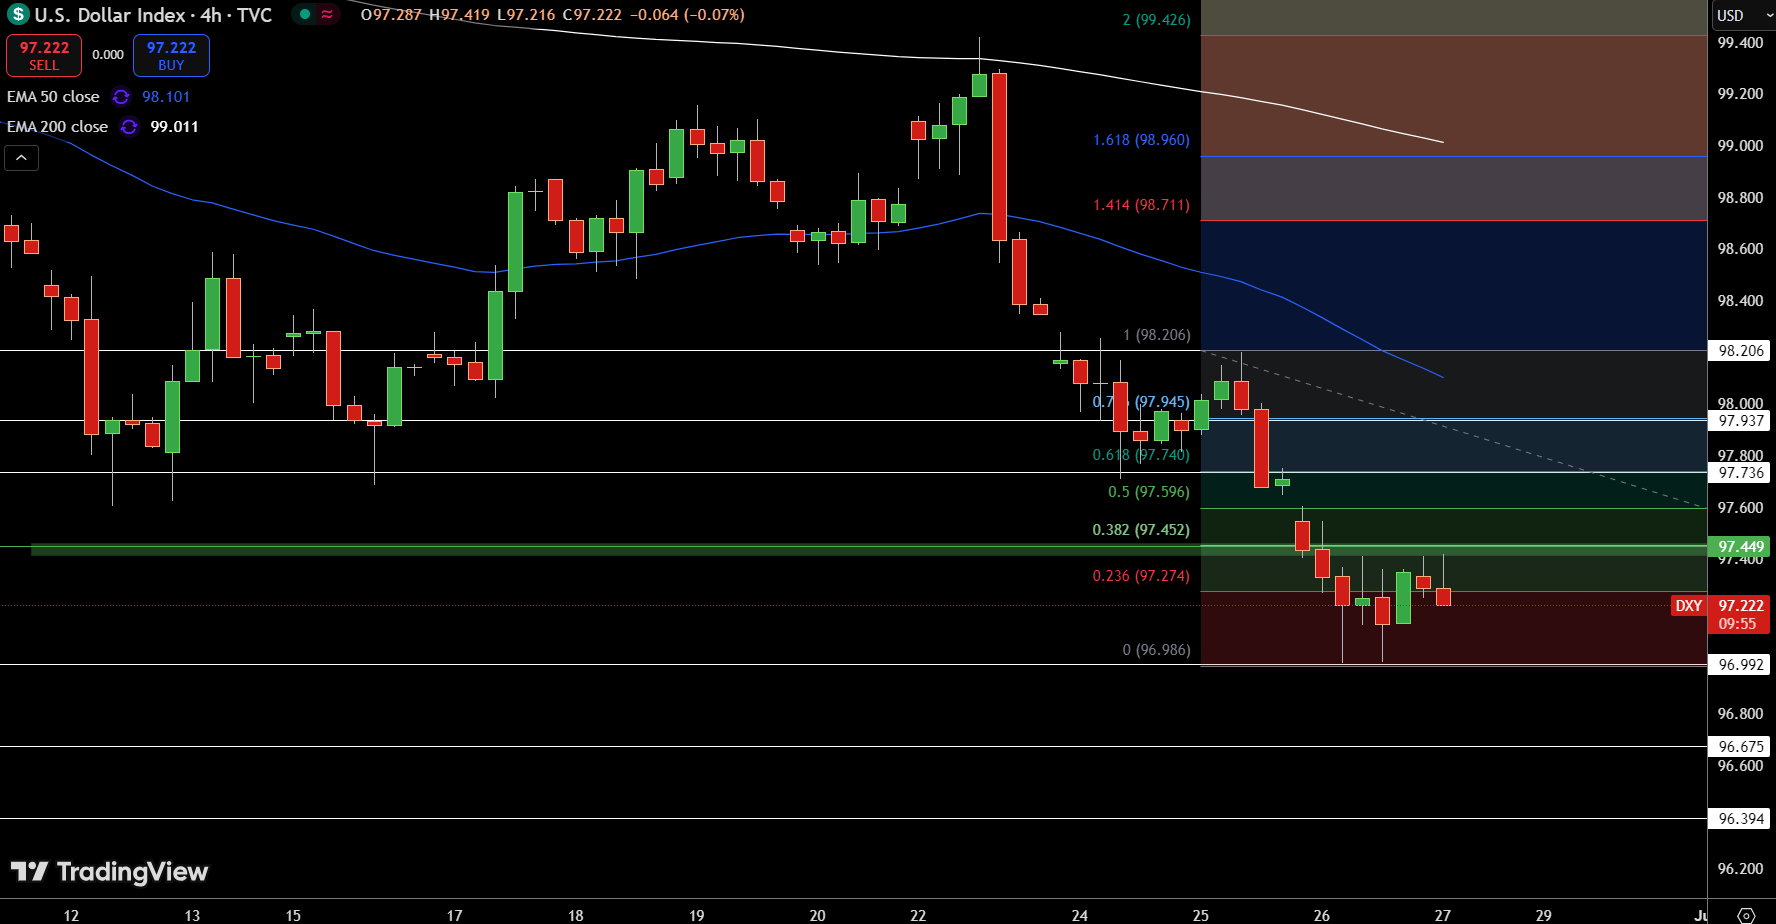
The U.S. Dollar Index (DXY) remains under pressure, consolidating near 97.22 after failing to reclaim the 0.382 Fibonacci retracement level at 97.45. The 50-period EMA at 98.10 continues to act as dynamic resistance, while price action struggles below the 200-EMA at 99.01. Key short-term support lies around 97.27 (0.236 Fib), with a break below likely exposing the 96.98 swing low.
Despite multiple attempts, bulls have not regained control above 97.45, indicating persistent selling pressure. A close above 97.74 (0.618 Fib) is needed to shift momentum.
Until then, the DXY appears range-bound, with a bias tilted lower unless the price closes firmly above 97.95.
GBP/USD Technical Analysis
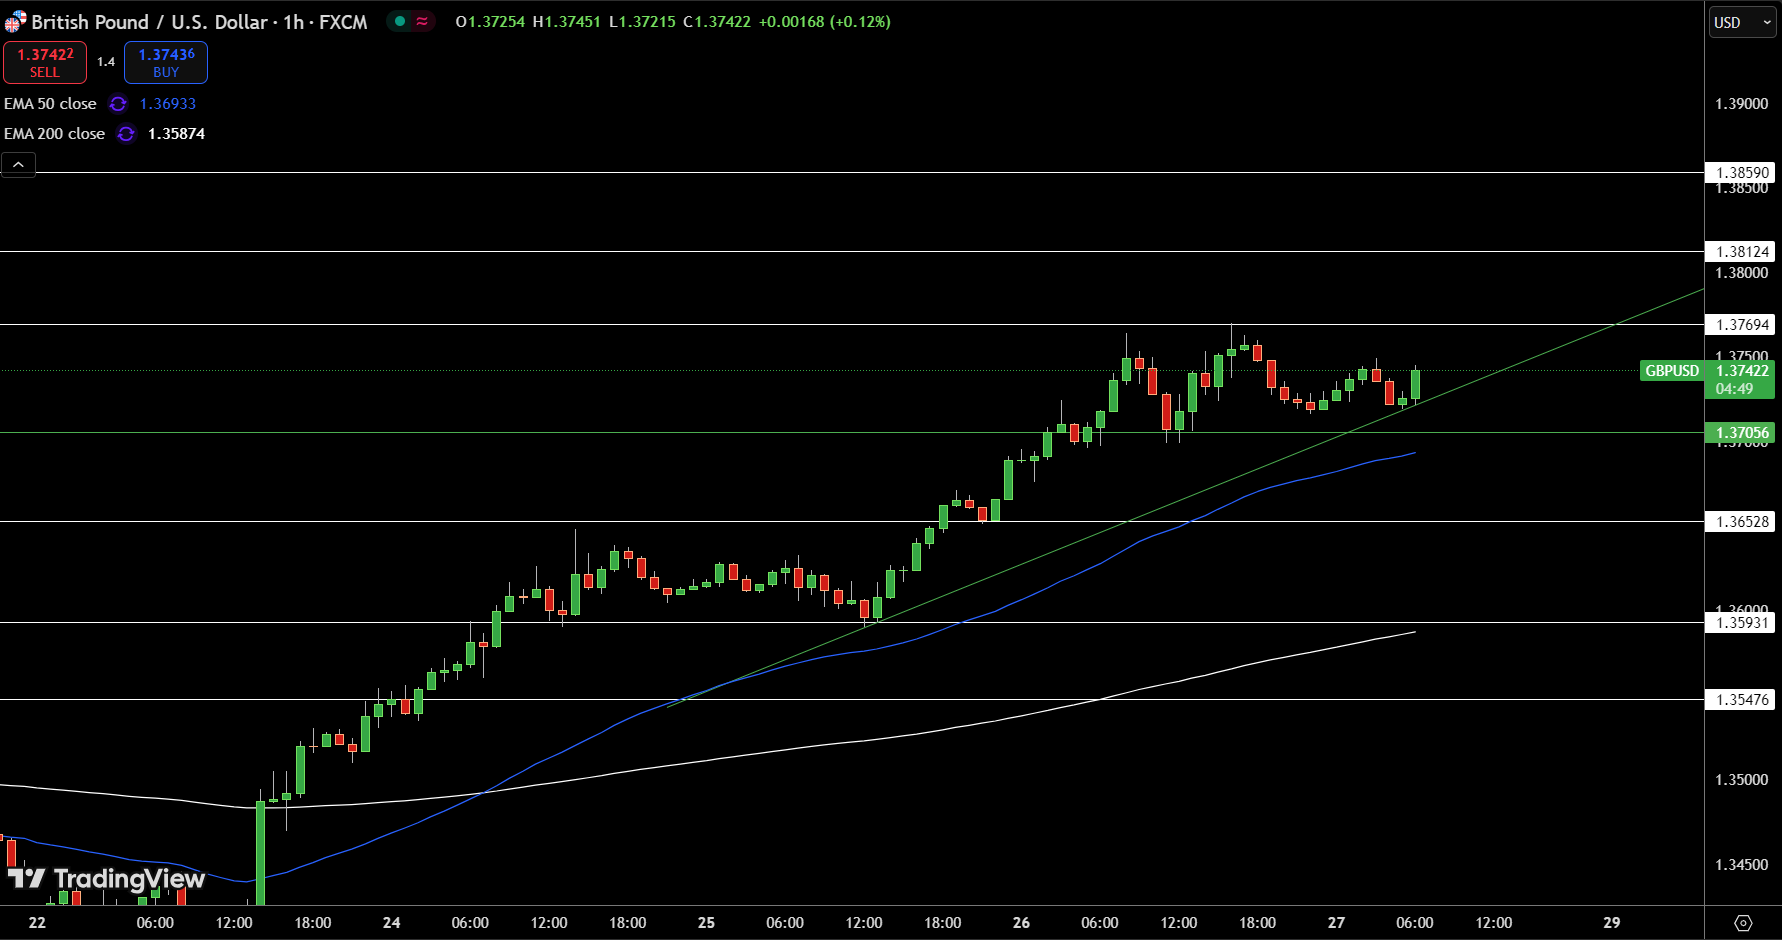
GBP/USD is trading at $1.3742, maintaining its bullish structure above the ascending trendline. The pair recently bounced off the $1.3705 support, which aligns with the 50-EMA, confirming short-term buying interest.
Momentum remains positive as price holds above the 200-EMA at $1.3587, signaling sustained strength. Immediate resistance is seen at $1.3769, and a breakout above this level may open the door to $1.3812 and $1.3859. A failure to hold $1.3705 could trigger a pullback toward $1.3652.
As long as the structure stays above the trendline and 50-EMA, bulls appear in control, with dips likely to be bought.
EUR/USD Technical Forecast
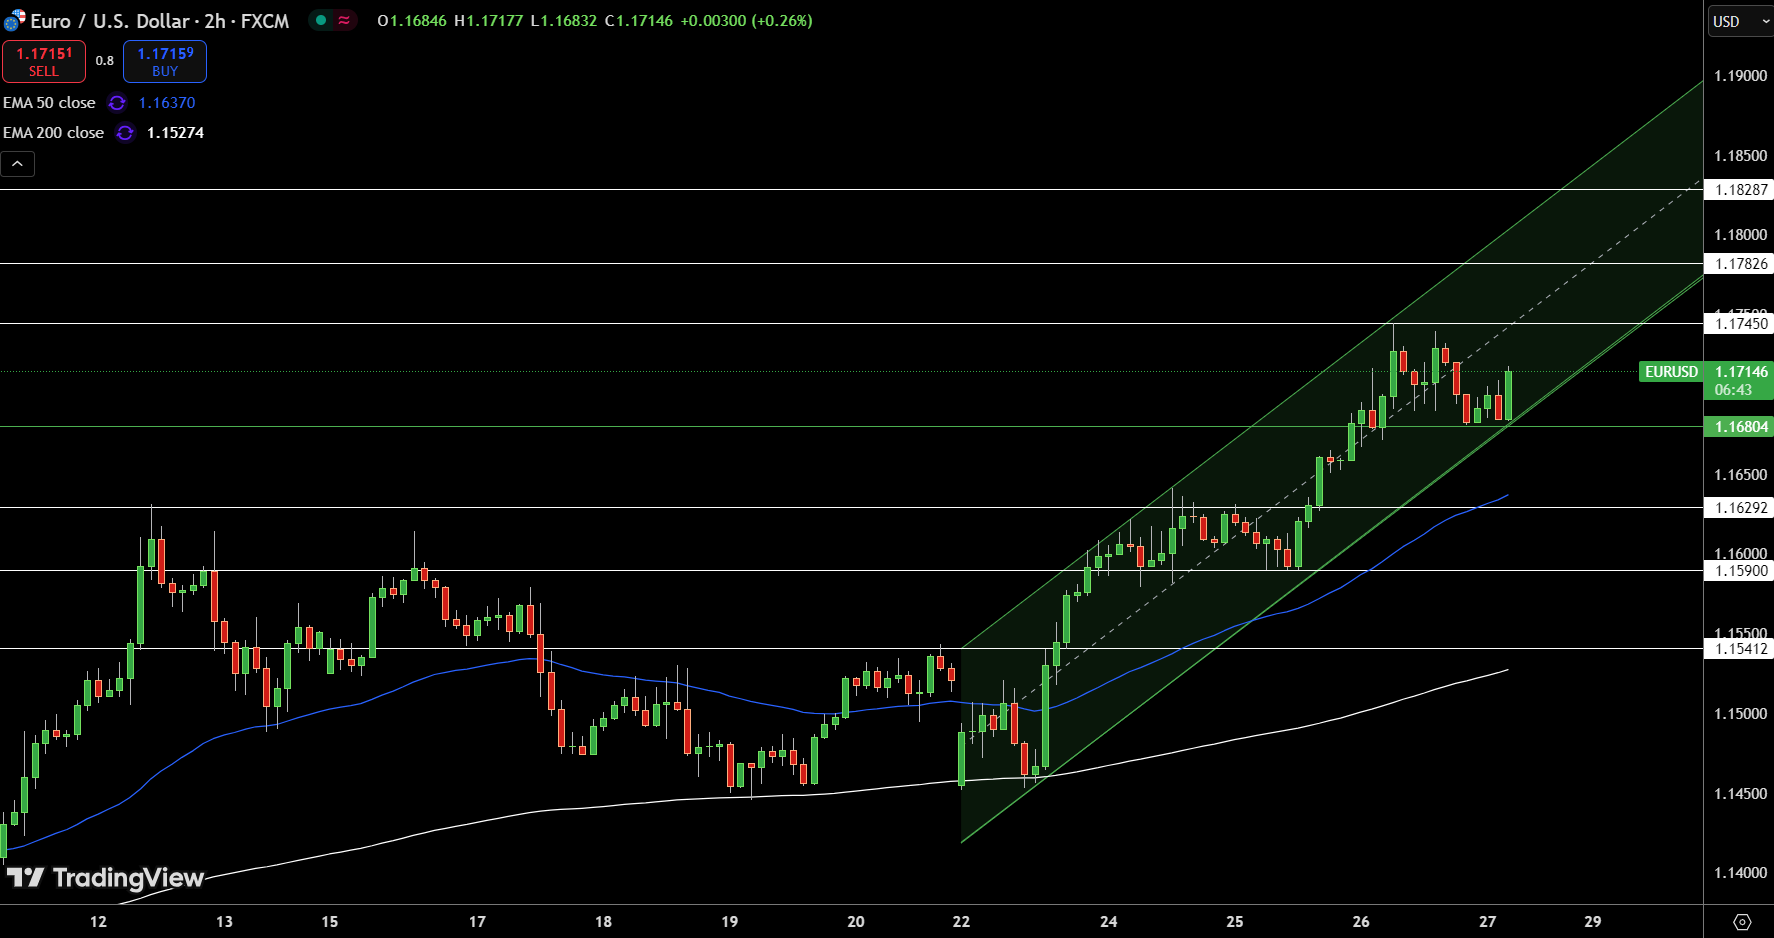
EUR/USD is trading at $1.1714, maintaining a bullish structure within a rising channel. Price has respected dynamic support along the midline and held above the 50-period EMA at $1.1637, reinforcing positive short-term momentum. Buyers continue to defend the $1.1680 level, which now acts as a pivot zone.
The next resistance sits at $1.1745, and a clear break above it could open the door to $1.1782 and $1.1828. Conversely, a break below the channel base may signal short-term exhaustion, with downside levels at $1.1629 and $1.1590.
Overall, the trend remains intact while price stays within the ascending structure and above key EMAs.
About the Author
Bob MasonChief Crypto Boss
123456789 30 He has written extensively for a broader audience and his current focus is on developments relating to the financial markets including, but not limited to currencies, commodities, alternative asset classes, and global equities.


Advertisement